Los indicadores leading (indicadores proactivos o adelantados) miden acciones, comportamientos y condiciones que ocurren antes de un incidente, con foco en la prevención. Los indicadores lagging (indicadores reactivos o rezagados) miden los resultados ya registrados, como accidentes, ausencias laborales y enfermedades ocupacionales. Juntos, ambos tipos forman el sistema completo de desempeño en SST (Seguridad y Salud en el Trabajo), exigido por la ISO 45001:2018 y las principales normas de seguridad y salud laboral a nivel mundial.
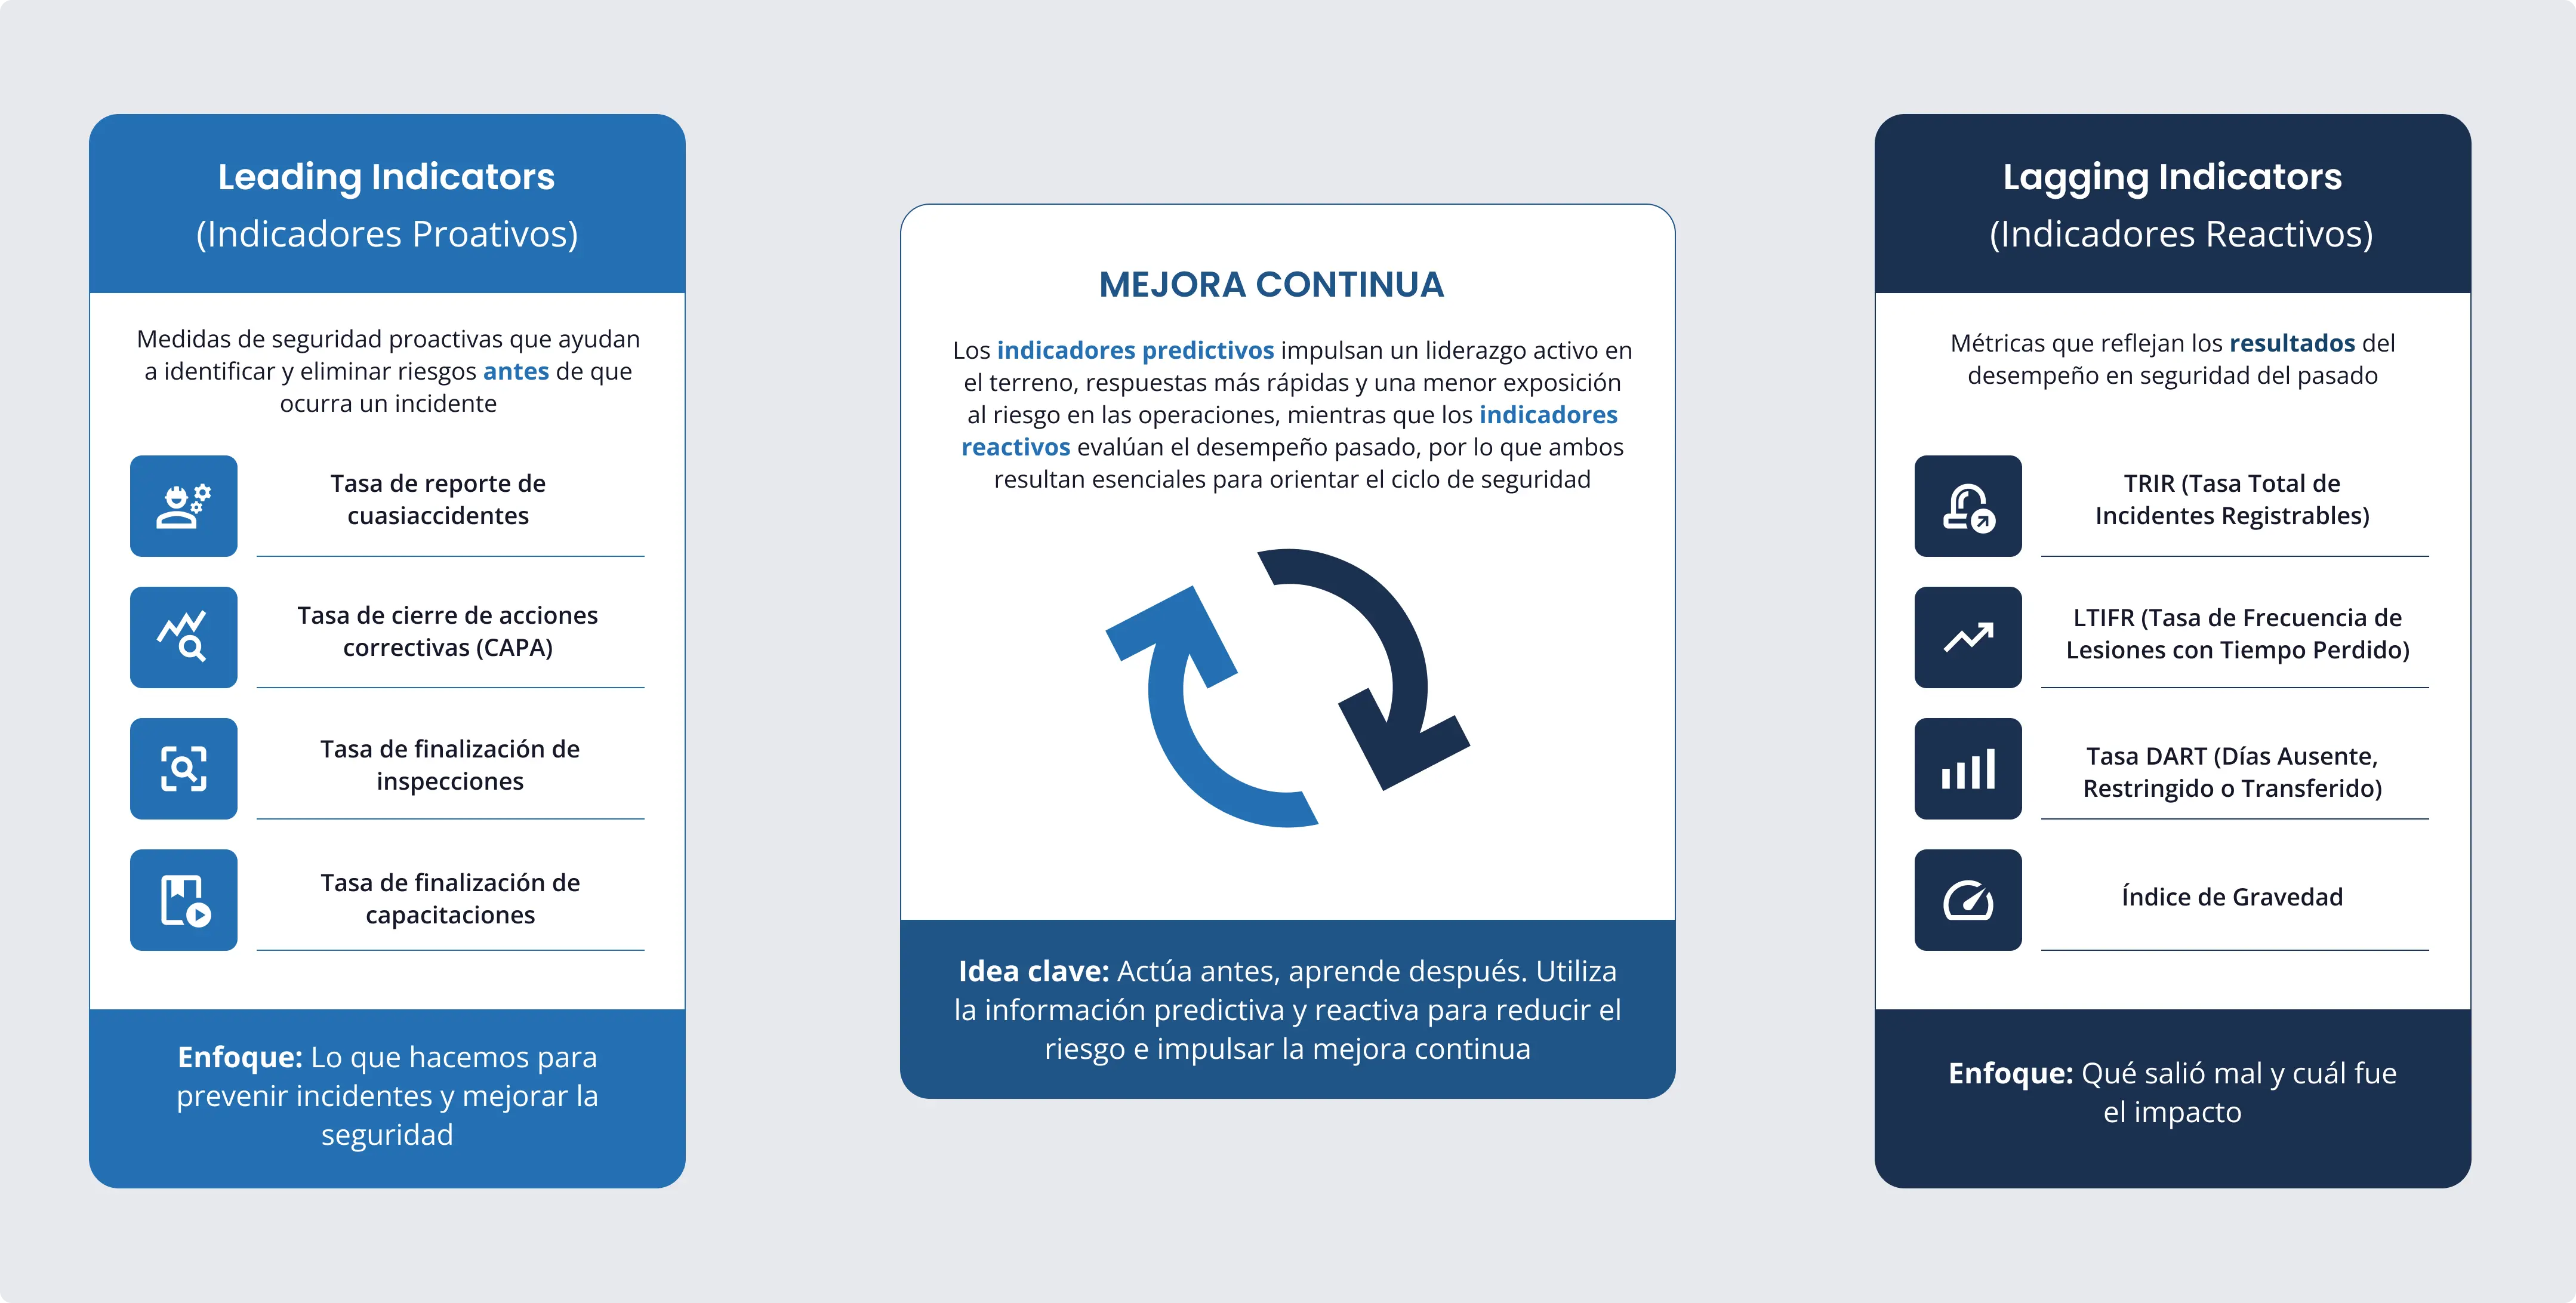
Los indicadores leading y lagging en SST son dos tipos de métricas complementarias: los indicadores leading miden acciones preventivas y condiciones antes de que ocurra un incidente, mientras que los indicadores lagging registran los resultados del desempeño de seguridad pasado, como lesiones y enfermedades relacionadas con el trabajo.
Desde el punto de vista normativo, la ISO 45001:2018, en su Cláusula 9.1.1 (Seguimiento, medición, análisis y evaluación), exige que las organizaciones utilicen medidas tanto cualitativas como cuantitativas para monitorear, medir, analizar y evaluar el desempeño de SST. Las Prácticas Recomendadas de la OSHA para Programas de Seguridad y Salud y la norma estadounidense ANSI/ASSP Z16.1-2022 refuerzan el mismo principio: un sistema de métricas equilibrado que combine indicadores leading y lagging es más eficaz que depender exclusivamente de un solo tipo.
En el contexto hispanohablante, la Ley 31/1995 de Prevención de Riesgos Laborales en España, la NOM-030-STPS-2009 en México, el Decreto 1072/2015 en Colombia, la Ley 29783 en Perú y la Ley 19587 en Argentina exigen la implementación de medidas preventivas y evaluación de riesgos: el fundamento normativo de los indicadores leading. La terminología utilizada regionalmente es indicadores proactivos o adelantados (leading) e indicadores reactivos o rezagados (lagging).
La dependencia exclusiva de indicadores lagging es uno de los fallos más comunes en la gestión de SST. Una tasa de accidentes cero puede indicar un entorno genuinamente seguro, o puede indicar una cultura de infra-notificación. Los indicadores leading permiten identificar el riesgo antes de que se materialice.
Los indicadores leading dan al responsable de SST visibilidad sobre la efectividad de las intervenciones antes de que ocurra un accidente. Al monitorear tasas de conclusión de inspecciones, número de cuasi-accidentes notificados o porcentaje de planes de acción cerrados en plazo, el responsable puede actuar sobre los precursores del riesgo. Los indicadores lagging, por su parte, proporcionan el historial de desempeño necesario para benchmarking sectorial, análisis de tendencia y reportes regulatorios.
Para la alta dirección, los indicadores lagging se traducen directamente en costes: los accidentes generan indemnizaciones, interrupciones de producción, aumento de primas de seguros y daños reputacionales. Los indicadores leading, en cambio, permiten anticipar ese coste y demostrar el retorno sobre la inversión en seguridad. Las organizaciones con un portafolio equilibrado de indicadores pueden justificar inversiones preventivas con datos, no con argumentos subjetivos.
Recursos Humanos y Operaciones se benefician de los indicadores leading para monitorear la cultura de seguridad: tasa de participación en formaciones, número de charlas de seguridad (Toolbox Talks) realizadas, o porcentaje de trabajadores con certificaciones vigentes. Los indicadores lagging como días perdidos y tasa de absentismo por accidente impactan directamente en la planificación de plantilla y los costes laborales.
Un indicador leading en SST es cualquier métrica que mide una acción, comportamiento, sistema o condición que influye en los resultados futuros de seguridad. La característica definitoria es que existe y puede medirse antes de que ocurra un evento adverso.
Los indicadores leading pueden agruparse en tres grandes categorías:
La principal trampa con los indicadores leading es medir actividad en lugar de impacto. Contar el número de formaciones realizadas dice poco si el aprendizaje no se verifica. Contar el número de inspecciones no es útil si los elementos verificados no son los de mayor riesgo. La norma ANSI/ASSP Z16.1-2022 recomienda que los indicadores leading sean evaluados por su valor predictivo: ¿tiene el indicador elegido una correlación demostrable con la reducción de incidentes?
Un buen indicador leading debe ser: específico (asociado a un riesgo concreto), medible (datos recopilables de forma consistente), accionable (cuando se deteriora, existe una respuesta clara), relevante (vinculado a los riesgos prioritarios de la operación) y predictivo (hay evidencia o lógica de que su deterioro antecede a eventos adversos).
Un indicador lagging en SST es cualquier métrica que mide un resultado ya ocurrido. Son los indicadores tradicionales de desempeño en seguridad y los más utilizados para benchmarking sectorial y reportes regulatorios.
Cada país hispanohablante utiliza sus propias métricas y umbrales de notificación. En España, el INSST publica estadísticas de accidentes de trabajo con metodología propia (accidentes en jornada laboral con y sin baja). En México, el IMSS publica tasas de incidencia laboral. En Argentina, la SRT publica el Índice de Incidencia. En Colombia, el FASECOLDA registra la tasa de accidentalidad. En Chile, el ISL publica indicadores de siniestralidad. Para comparar con benchmarks internacionales (OSHA, ISO), se recomienda calcular el TRIR utilizando los criterios OSHA (denominador 200.000 horas) con independencia de las obligaciones legales nacionales de notificación.
Los indicadores reactivos tienen dos limitaciones estructurales que requieren una interpretación cuidadosa. En primer lugar, dependen del volumen: en operaciones más pequeñas, un solo accidente puede alterar drásticamente la tasa, haciendo que la cifra sea estadísticamente ruidosa. Una empresa con 20 trabajadores que experimenta 1 incidente puede arrojar un TRIR aparentemente alarmante, pero esta cifra aislada no permite extraer conclusiones sobre tendencias. En segundo lugar, miden el pasado: son útiles para identificar patrones y tendencias históricas, pero no anticipan el próximo evento.
Una interpretación correcta requiere analizar las tendencias durante 3 a 5 años antes de evaluar un periodo aislado; comparar con puntos de referencia dentro del mismo sector y clasificación de actividad; considerar el volumen de horas trabajadas como denominador; y combinar siempre con indicadores predictivos para comprender si una tendencia refleja una mejora genuina o simplemente una ausencia de notificaciones.
Una organización con cero accidentes registrados no es necesariamente segura. Este fenómeno se conoce como la paradoja del cero accidente. Puede producirse por: infra-notificación cultural (trabajadores que no notifican por miedo a represalias o presión por resultados), bajo volumen (sin incidentes registrables por ser una operación pequeña), suerte estadística (el riesgo existe pero aún no se ha materializado), o exclusión de terceros (contratistas y trabajadores temporales no incluidos en los cálculos). Los indicadores leading activos y las altas tasas de notificación de cuasi-accidentes son las mejores señales de que el cero es genuinamente alcanzado.
La siguiente tabla resume las principales diferencias entre ambos tipos de indicadores y cómo se complementan en un sistema eficaz de gestión de SST.
El Triángulo de Heinrich (1931) y la versión posterior de Bird (1969) establecen que por cada accidente grave existen múltiples accidentes leves, incidentes sin lesión y, en la base, una cantidad muy superior de comportamientos inseguros y condiciones de riesgo no tratadas. Esta estructura conecta directamente los indicadores leading y lagging: los indicadores lagging miden la cúspide del triángulo (eventos ya materializados), mientras que los indicadores leading monitorizan la base (comportamientos, condiciones y controles que alimentan el triángulo). Reducir la base significa reducir la cúspide.
Importante: el triángulo de Heinrich tiene limitaciones reconocidas en la literatura científica. Las proporciones originales (1:29:300) no son universalmente válidas y varían según el sector y el tipo de riesgo. Su valor principal es conceptual: demuestra que la seguridad proactiva (indicadores leading) actúa sobre los factores que, si se acumulan, eventualmente generan eventos graves.
No existe un conjunto universal de indicadores leading y lagging válido para todas las operaciones. La selección debe estar orientada por el perfil de riesgo específico de cada organización y alineada con los requisitos de la ISO 45001 o el marco normativo nacional aplicable.
El punto de partida es la evaluación de riesgos. Los indicadores leading más eficaces derivan directamente de los peligros de mayor severidad y probabilidad identificados. Una operación química con riesgo de liberación de sustancias peligrosas debe monitorear la conformidad de las inspecciones de integridad y la frecuencia de simulacros de emergencia, no solo las tasas de accidente.
Cada indicador debe ser: específico (vinculado a un riesgo o proceso concreto), medible (datos recopilables de forma consistente), accionable (el deterioro genera una respuesta inmediata), relevante (asociado a riesgos prioritarios) y temporal (con frecuencia de recogida y meta definidas). Un indicador sin meta y sin responsable no es un indicador útil, es simplemente un dato.
Una buena práctica es construir un portafolio con al menos 2 a 3 indicadores leading por cada indicador lagging monitorizado. Así la organización no depende únicamente de datos históricos. La distribución recomendada: indicadores de participación (cultura y liderazgo), indicadores de proceso (conformidad de controles) e indicadores de resultado (lagging, para benchmarking y cumplimiento).
La ISO 45001 estructura la gestión de SST en el ciclo PDCA (Planificar-Hacer-Verificar-Actuar). Los indicadores encajan naturalmente: Planificar (definir qué indicadores monitorizar y establecer metas), Hacer (capturar datos en campo), Verificar (analizar tendencias y desviaciones), Actuar (intervenir cuando los indicadores se deterioran). La Cláusula 9.1.1 especifica que la organización debe monitorizar tanto la efectividad de los controles operativos (leading) como los resultados de salud y seguridad (lagging).
Los indicadores más relevantes varían según el perfil de riesgo de cada sector. La siguiente tabla presenta los indicadores leading y lagging más utilizados en los principales sectores industriales.
Históricamente, la recogida de datos de SST era manual, sujeta a retrasos, inconsistencias y baja visibilidad. Los formularios en papel, las hojas de cálculo y los sistemas aislados hacían imposible hacer seguimiento de los indicadores leading en tiempo real, lo que limitaba su utilidad como herramientas de prevención.
La digitalización de las operaciones industriales, impulsada por una EHSQ digital solution that connects EHSQ teams with field operators, ha transformado este escenario. Hoy es posible capturar datos de inspecciones, cuasi-accidentes, ACPA y charlas de seguridad directamente en campo mediante dispositivos móviles, con geolocalización, fotografía y firma digital. Esto reduce la fricción en la notificación y aumenta la calidad y el volumen de los datos, haciendo que los indicadores leading sean genuinamente proactivos y no solo retrospectivos.
Las plataformas modernas permiten correlacionar automáticamente indicadores leading y lagging, identificar patrones (qué ubicaciones o equipos tienen peores tasas de cuasi-accidentes y cómo se correlaciona eso con el TRIR), y generar alertas cuando los indicadores se deterioran. El resultado es una gestión de SST que actúa sobre causas, no solo sobre consecuencias.
.webp)
Los indicadores leading miden acciones y condiciones antes de un incidente, con foco en la prevención (ej.: tasa de inspecciones realizadas). Los indicadores lagging miden los resultados tras el evento (ej.: número de accidentes con baja). La diferencia fundamental es temporal: uno apunta hacia dónde va la seguridad, el otro registra dónde ha estado.
Sí. La ISO 45001:2018, en la Cláusula 9.1.1, exige que la organización monitorice, mida, analice y evalúe el desempeño de SST, incluyendo tanto medidas de la efectividad de los controles operativos (leading) como los resultados de salud y seguridad (lagging). Las organizaciones certificadas en ISO 45001 deben tener ambos tipos de indicadores documentados y activamente monitorizados.
Los indicadores leading de mayor valor predictivo y más fáciles de implementar son: (1) tasa de notificación de cuasi-accidentes, (2) porcentaje de ACPA cerradas en plazo y (3) tasa de inspecciones periódicas realizadas. Estos tres indicadores cubren participación de la fuerza laboral, efectividad correctiva y cumplimiento operacional.
No necesariamente. Un TRIR de cero puede reflejar una operación genuinamente segura, pero también puede indicar una falta de notificación, un bajo volumen de horas trabajadas (sin significancia estadística) o la exclusión de contratistas en los cálculos. La paradoja de cero daños es un riesgo real: las organizaciones centradas exclusivamente en no registrar accidentes pueden crear una cultura de miedo y ocultación de datos. Los indicadores predictivos activos son la señal más sólida de una operación con un riesgo genuinamente bajo.
No existe un número óptimo universal, pero la práctica recomendada es enfocarse en calidad, no en cantidad. Un portafolio de 5 a 10 indicadores relevantes y bien gestionados genera más valor que 30 métricas recogidas de forma inconsistente. La regla práctica: por cada indicador lagging monitorizado, deben existir al menos 2 indicadores leading relacionados.
La gestión de seguridad basada solo en indicadores lagging tiende a ser delegada al departamento de SST. Los indicadores leading necesitan el liderazgo operativo: vincular su desempeño a las evaluaciones de directivos y supervisores, incluir estos datos en las reuniones mensuales de operaciones y garantizar que cada responsable de área sea accountable de sus indicadores de seguridad proactiva.
La Ley 31/1995 en España y sus equivalentes en América Latina no nombran explícitamente “indicadores leading”, pero las obligaciones de evaluación de riesgos, planificación preventiva y vigilancia de la salud que establecen son la base normativa de los indicadores proactivos. Las organizaciones certificadas en ISO 45001 tienen la obligación normativa explícita de utilizar ambos tipos de indicadores.
El Triángulo de Heinrich y la actualización de Bird sugieren que por cada accidente grave existen múltiples incidentes menores y, en la base, una cantidad muy superior de comportamientos y condiciones inseguros. Los indicadores leading monitorizan la base del triángulo, los precursores que, si se acumulan, generan eventos en la cúspide. Reducir la base mediante indicadores leading es la lógica de la prevención proactiva.
Un indicador leading de calidad tiene: correlación demostrable con riesgos reales de la operación, datos recopilables de forma consistente y sin sesgo, meta definida basada en benchmark o historial interno, y un responsable claro. Además, debe ser validado periódicamente: si ha mejorado de forma consistente sin impacto en los indicadores lagging, puede estar midiendo actividad sin impacto real en el riesgo.
El trabajador de campo es la principal fuente de datos de indicadores leading. Es quien notifica cuasi-accidentes, identifica condiciones inseguras, participa en inspecciones y completa las ART (Análisis de Riesgo de Tarea). Por ello, el compromiso de los trabajadores con el sistema de notificación es fundamental. Procesos fáciles, libres de cultura punitiva y con retorno visible sobre cada notificación son los principales factores para altas tasas de participación.
Solicite su demostración
Comience su viaje de trabajador conectado EHSQ con Glartek y conviértase en un líder en su industria.
Solicite una demostración.webp)
Descubra el poder del único Solución EHSQ nativa de IA diseñado para la primera línea