
The Bradley Curve is a maturity model that describes how an organisation's safety culture evolves through four stages, reactive, dependent, independent and interdependent, linking each stage to a shift in who owns safety and to a downward trend in injury rates. It is a diagnostic and communication tool, not a standard or a measurement method.
The Bradley Curve is a safety culture maturity model that maps how an organisation approaches prevention across four successive stages: reactive, dependent, independent and interdependent. The core idea is simple and powerful. As an organisation stops reacting to accidents and moves towards shared ownership of safety, injury rates tend to fall. The model is drawn as a curve that trends down and to the right, crossing the four stages.
The model emerged within DuPont in the mid-1990s and is now promoted by the consultancy DSS+ (formerly DuPont Sustainable Solutions). One point of honesty that almost no page addresses: the individual authorship and the exact year are not documented in a primary, peer-reviewed publication, and the higher stages draw on Stephen Covey's principles of dependence, independence and interdependence. It is best to treat the Bradley Curve as a useful communication tool rather than an empirically validated theory.
It helps to place the model within the origin of the safety culture concept itself. The term gained traction after the Chernobyl nuclear accident in 1986, when the IAEA's INSAG described safety culture as the assembly of characteristics and attitudes that ensures safety issues receive the attention warranted by their significance. In Europe, EU Framework Directive 89/391/EEC and ISO 45001:2018 anchor this in practice, particularly clause 5.1, leadership and commitment, and clause 5.4, consultation and participation of workers. In the UK, the HSE builds its guidance (HSG65) on the widely cited definition from the Health and Safety Commission: the product of individual and group values, attitudes and behaviours that determine an organisation's commitment to health and safety. In the UAE, MoHRE and the OSHAD framework in Abu Dhabi place growing weight on leadership-driven safety culture beyond documentary compliance.
In the reactive stage, safety is driven by instinct and accidents are seen as an unavoidable cost of doing business. The organisation acts only after something goes wrong: an accident, a regulatory citation or a new legal requirement. Management commitment is low, training is inadequate and hazard communication is inconsistent. No one feels safety is theirs. Injury rates are high and volatile, and hidden costs such as absenteeism, turnover and disruption erode the operation without appearing on the shift report.
In the dependent stage, safety comes to mean obeying rules imposed by supervision. Motivation is external: the worker complies to avoid reprimand, not out of conviction. Systems exist on paper, with procedures and discipline in place, but safe behaviour depends on someone watching. This stage delivers quick, visible gains over the reactive stage, and it is where many certified organisations stall: they have good systems, but compliance does not carry over to the moments when no one is looking.
The move to the independent stage is an internal shift. The worker takes personal responsibility for their own safety, which becomes a value rather than an obligation. There is self-management, technical competence and a willingness to refuse an unsafe task. A clear sign of this stage is a substantial rise in near miss and hazard reporting, because people stop fearing that reporting will be used against them and start seeing value in it. Injury rates keep falling.
The interdependent stage is the model's aspirational point. Safety is collective property: people look out for one another, correct colleagues as a matter of course and step in to protect those beside them. Learning from near misses is continuous and the organisation operates close to zero harm. It is worth stressing that this position is not permanent. Under production pressure, cost cutting, restructuring or a change in leadership, a mature culture can regress. Maturity is earned continuously, not banked.
The table below summarises the four stages and what has to change to move on.
The Bradley Curve matters because it gives a shared vocabulary for a difficult conversation: why accidents keep happening even when systems appear to be in order. It shifts the focus from how many accidents occurred to what kind of culture produces them, and that changes how each part of the organisation acts.
The curve helps diagnose why an organisation has stalled. If indicators have stopped improving despite more rules and audits, the culture is probably stuck in the dependent stage. The model points the way: the next step change comes not from more control but from transferring ownership of safety to the people doing the work. It also supports the case for investing in near miss reporting and behaviour observation, the signals that distinguish a mature culture.
For leadership, the curve links culture to financial outcome. According to the National Safety Council's Injury Facts 2024, the average cost of a disabling injury is around USD 48,000 and a fatality approaches USD 1.54 million. Prevention studies cited by the ISSA and DGUV point to a return of roughly EUR 2.20 for every euro invested in prevention. Progressing along the curve is not a compliance exercise: it reduces a class of cost that rarely shows up in consolidated form.
A culture that climbs the curve is a culture that trusts. Near miss reporting only grows when people know they will not be punished for speaking up, which requires a just culture that separates honest error from negligence. For HR, this connects to engagement, retention and organisational climate. For operations, it means fewer unplanned stoppages and a workforce that solves problems before they become incidents.
The Bradley Curve graph is deliberately simple.The horizontal axis represents safety culture maturity over time, from thereactive to the interdependent stage. The vertical axis represents the injuryrate. The line trends down and to the right: the more mature the culture, thelower the harm. It is a descriptive graph, not a prescriptive one. It shows anobserved association between maturity and outcome, but it provides nomeasurement scale and does not prove that moving up a stage, on its own, causes injuries to fall. That distinction matters, and we return to it in thelimitations section.
.webp)
The Bradley Curve is the best-known maturity model, but it is neither the only one nor the most academically rigorous. Knowing the neighbouring models helps you choose the right language and avoid mistaking a communication tool for a validated assessment instrument.
The Hudson and Parker model, grounded in research at Leiden University and the energy industry, describes five levels: pathological, reactive, calculative, proactive and generative. It is regarded as the academic foundation of safety culture maturity and gave rise to the Hearts and Minds toolkit, now published by the Energy Institute, with diagnostic instruments. Westrum's typology, focused on information flow, distinguishes pathological, bureaucratic and generative organisations. A rough mapping helps translate between models.
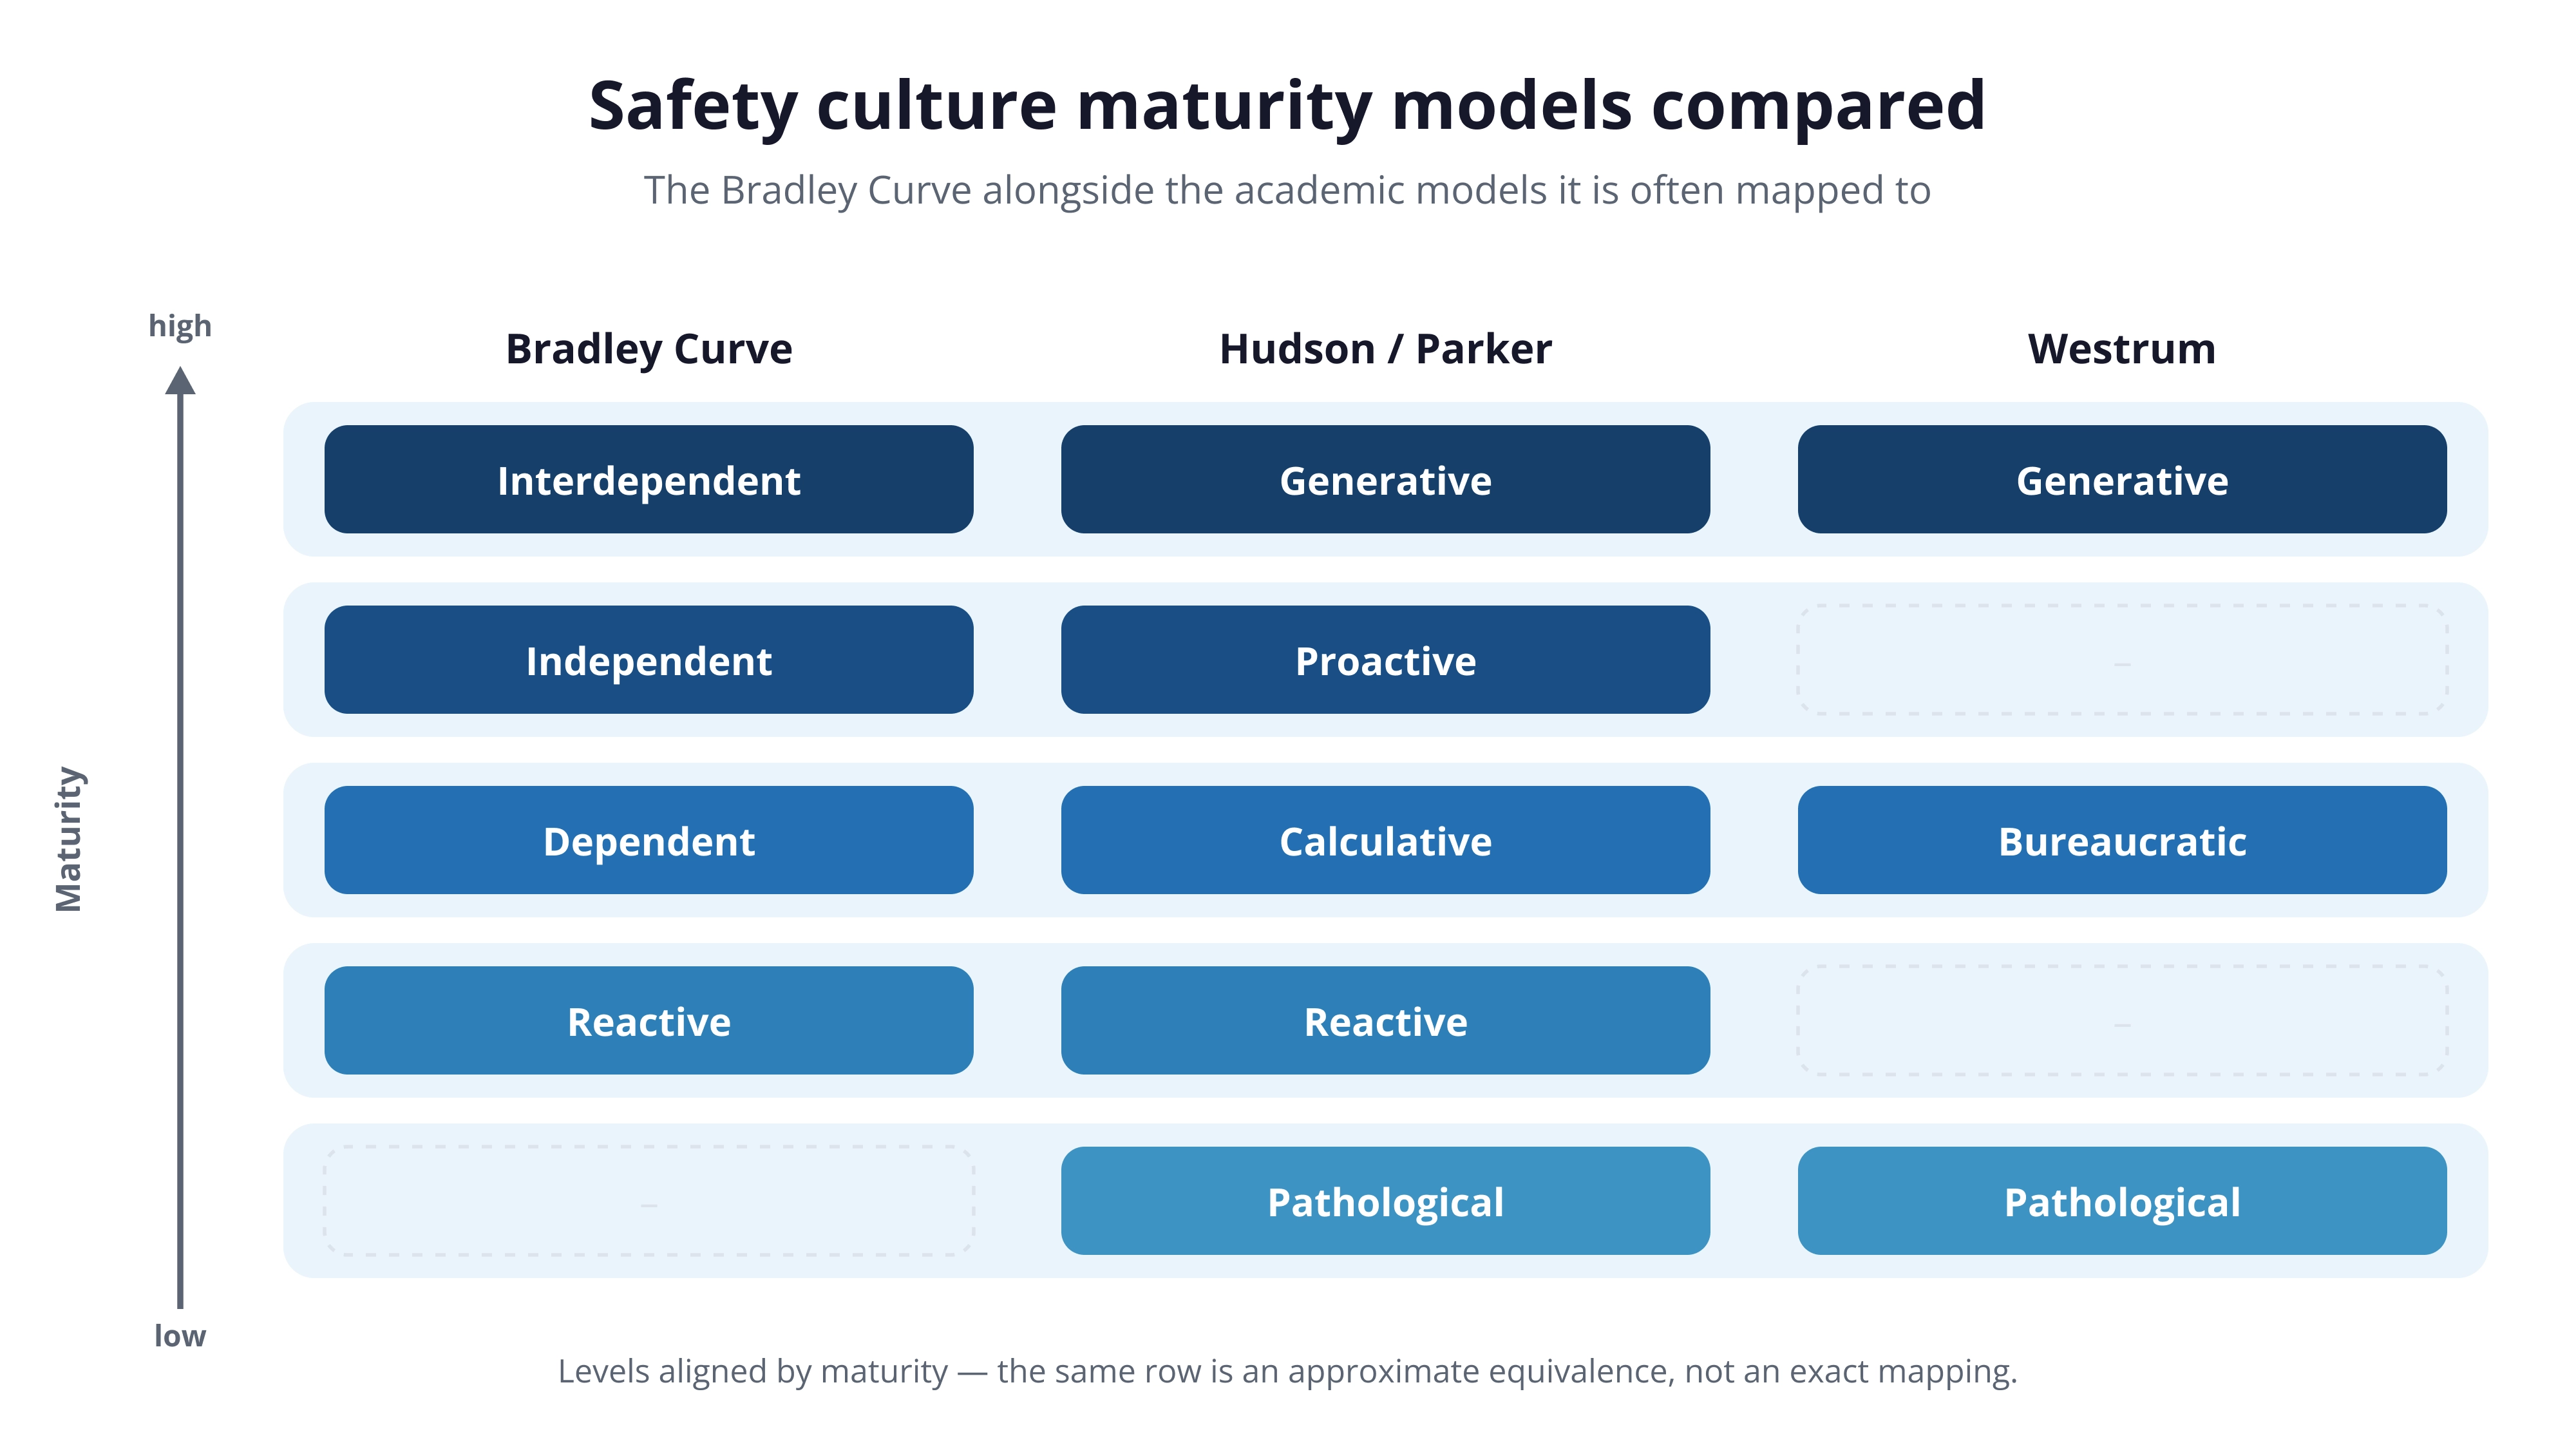
A useful practical observation: many ISO 45001 certified organisations settle at the equivalent of Hudson's calculative level, with mature systems but a still-dependent culture. A management system is a necessary condition for reaching the higher stages, but not a sufficient one.
The Bradley Curve does not come with an official questionnaire. Assessing which stage an organisation is at requires triangulating several methods: safety climate and perception surveys, structured leadership interviews, frontline focus groups and direct behaviour observation. A single survey score misleads; a reliable reading comes from combining sources.
A structured progression path usually follows four steps:
1. Assess current maturity with combined quantitative and qualitative methods, to locate the real stage rather than the desired one.
2. Identify behaviour and system gaps, using root cause analysis of incidents and near misses to understand what the culture allows to happen.
3. Define action plans aligned with ISO 45001 continual improvement, with an owner, a deadline and a link to leading indicators.
4. Execute and monitor the impact on both leading and lagging indicators, adjusting course over time.
The levers that raise a culture are consistent: visible felt leadership, with managers holding safety conversations rather than inspections; competency-based training; genuine authority to stop an unsafe task; worker consultation and participation; and peer observation supported by psychological safety. The most common mistake is treating culture change as a project with an end date. It is not. It is a continuous operational commitment.
In an industrial packaging plant stuck in thedependent stage, operators wear hearing protection when the supervisor walks byand remove it the moment he leaves. The shift to the independent stage appearswhen an operator stops a line after spotting a removed machine guard, withoutwaiting for an order, and logs the occurrence. Where EHS and Quality share oneflow, the same operator who reports the near miss also records the qualitynon-conformance, in the same cycle.
At an electricity distribution utility, the reactive stage shows up in permits to work filled in on paper and signed out of habit. The culture matures when a field team with no signal refuses to start work at height because the permit to work (PTW) does not reflect a changed condition on site, and that refusal is backed by management rather than penalised.
In the chemical industry, where a failure can escalate quickly, the interdependent stage is visible when a technician interrupts a colleague's procedure after noticing a deviation in energy isolation (LOTO), and both treat the interruption as normal. A mature culture does not depend on the most experienced technician being present; it depends on everyone owning each other's defence.
In paper and pulp, with high risk in confined spaces and pinch points, the dependent stage produces checklists completed without any real inspection. Progress along the curve shows up in rising near miss reports around rollers and presses, a sign that the frontline has started to see the hazard before the event rather than after it.
In pharmaceuticals, where traceability is a culture already embedded through quality, the challenge is to extend that same discipline to safety behaviour. The independent stage takes hold when the operator who rigorously documents a process deviation begins to document a safety near miss with equal rigour, treating both as learning rather than blame.
In food and beverage, the quality culture driven by HACCP and by BRC/IFS audits creates fertile ground for safety maturity. The interdependent stage appears when a filling-line team treats a slippery floor the way everyone treats a contamination risk: a shared problem, corrected at once, without waiting for the supervisor.
Using the Bradley Curve well starts with knowing what it is not. The criticisms of the model are serious, and ignoring them undermines the credibility of any programme.
First, the empirical base is weak. There is little to no peer-reviewed evidence behind the model, and the injury-reduction figures so often quoted trace back to promotional material rather than primary research. For that reason, this page does not attribute reduction percentages to the act of moving up the curve: doing so would repeat an unverifiable claim.
Second, association is not causation. The model assumes culture drives the outcome, but systemic factors such as a hazardous engineering design, production pressure or degraded controls can drive both the culture and the harm. A mature-looking culture with degraded engineering controls can still produce serious harm.
Third, there is the risk of a behavioural bias. Focusing on individual behaviour can divert attention from systemic hazards and major accidents. The process safety literature shows that the overwhelming majority of loss-of-containment events stem from organisational failures, not from frontline workers deliberately ignoring procedures.
Fourth, cultures do not progress in a straight line. They regress. Treating maturity as a ratchet that only turns upward is a costly error. Finally, the curve labels a state without measuring it and without prescribing a remedy. It does not replace an auditable management system or an improvement programme; it works best as a companion to ISO 45001, which provides the structure, and ISO 45003, which adds the psychosocial lens.
An organisation's position on the curve is directly reflected in the kind of metrics it can use. Reactive and dependent cultures live almost entirely on lagging indicators, which count what has already gone wrong. Independent and interdependent cultures move to leading indicators, which anticipate failure: near miss reporting rate, safety observations per worker, completion of safety conversations and the percentage of corrective actions closed on time.
The most universal lagging indicator is still the total recordable incident rate, calculated as:
TRIR = (number of recordable cases × 200,000) ÷ hours worked
A reliable sign of a mature culture is near miss reporting running substantially higher than the injury rate: a sign that the organisation identifies the hazard before it harms. To understand how this lagging indicator behaves along the curve and how to interpret it, refer to the full page: [TRIR — Total Recordable Incident Rate].
For decades, measuring safety culture depended on paper: observation cards in a box, near miss forms that rarely left the clipboard and annual surveys whose results arrived too late to act on. The analogue problem is structural: the more friction there is in reporting, the less people report, and it is precisely reporting that signals movement up the curve.
This is where EHSQ software comes in. By taking near miss and observation capture to the operator's point of work, with a simple interface and a robust offline mode, it removes the friction that suffocates reporting in the early stages. Data that was previously lost now feeds real-time leading-indicator dashboards, and corrective actions gain an owner, a deadline and a traceable record.
The Bradley Curve provides no measurement instrument, and that is exactly the gap technology fills. By correlating proactive reporting with the evolution of lagging indicators, EHSQ software helps management see the culture change rather than merely sense it. Technology is a capability that supports progression; it does not replace the leadership and trust that make a culture mature.
.webp)
It is a safety culture maturity model that describes four stages, reactive, dependent, independent and interdependent, and links each stage to a shift in who owns safety and to a downward trend in injury rates. It is a diagnostic and communication tool, not a standard or a measurement method.
Reactive, where no one owns safety and the organisation only reacts to accidents; dependent, where people comply because supervision imposes it; independent, where the worker takes personal responsibility; and interdependent, where the whole team looks out for one another. Injuries tend to fall across these four stages
The model emerged within DuPont in the mid-1990s and is now promoted by the consultancy DSS+. The individual authorship and the exact year are not documented in a primary publication, so it is best not to state a name or date categorically. The higher stages draw on Stephen Covey's principles.
No. It is a widely used communication tool, but it has no peer-reviewed empirical base and the injury-reduction figures often quoted trace back to promotional material. It should be used as a map and a vocabulary, ideally combined with an auditable management system such as ISO 45001.
The Bradley Curve has four stages and is mainly a communication tool with no measurement instrument of its own. The Hudson and Parker model has five levels, pathological, reactive, calculative, proactive and generative, and rests on published academic research, with diagnostic tools such as Hearts and Minds. Broadly, Bradley's independent stage is close to Hudson's proactive level.
By combining several methods: climate and perception surveys, leadership interviews, frontline focus groups and behaviour observation. A useful practical signal is the relationship between near miss reporting and the injury rate: the more people report before something happens, the more mature the culture tends to be.
Yes, and this is one of the most overlooked points. Under production pressure, cost cutting, restructuring or a change in leadership, a mature culture can slip back to earlier stages. Maturity is earned continuously; it is not guaranteed.
No. ISO 45001 is a management system with auditable requirements; the Bradley Curve is a conceptual model about culture. They work best together: the standard provides the structure and the evidence, especially clauses 5.1, leadership, and 5.4, worker participation, and the curve provides the language to talk about cultural maturity.
Mainly leading indicators: near miss reporting rate, safety observations per worker, completion of safety conversations and corrective actions closed on time. Lagging indicators such as TRIR tend to fall, but on their own they do not capture the change in culture.
By reducing reporting friction and making the culture visible. EHSQ software such as Glartek takes near miss and observation capture to the operator's point of work, with an offline mode, and turns that data into real-time leading-indicator dashboards with traceable corrective actions. That helps management see the culture evolve rather than guess at it.
Request your demo
Start your EHSQ software journey with Glartek and become a leader in your industry.
Schedule Demo.webp)
Discover the power of the only AI-Native EHSQ software built for the frontline

.webp)