Three stylized blue and turquoise glowing star shapes with subtle purple accents, arranged in a cluster.

AI-native software

EHSQ software built the people doing the work. Not just for reporting.

From field operators to EHS and Quality teams, Glartek is the EHSQ software your whole team actually uses.

Cut incidents
End paper-based processes
Turn data into decisions in real time
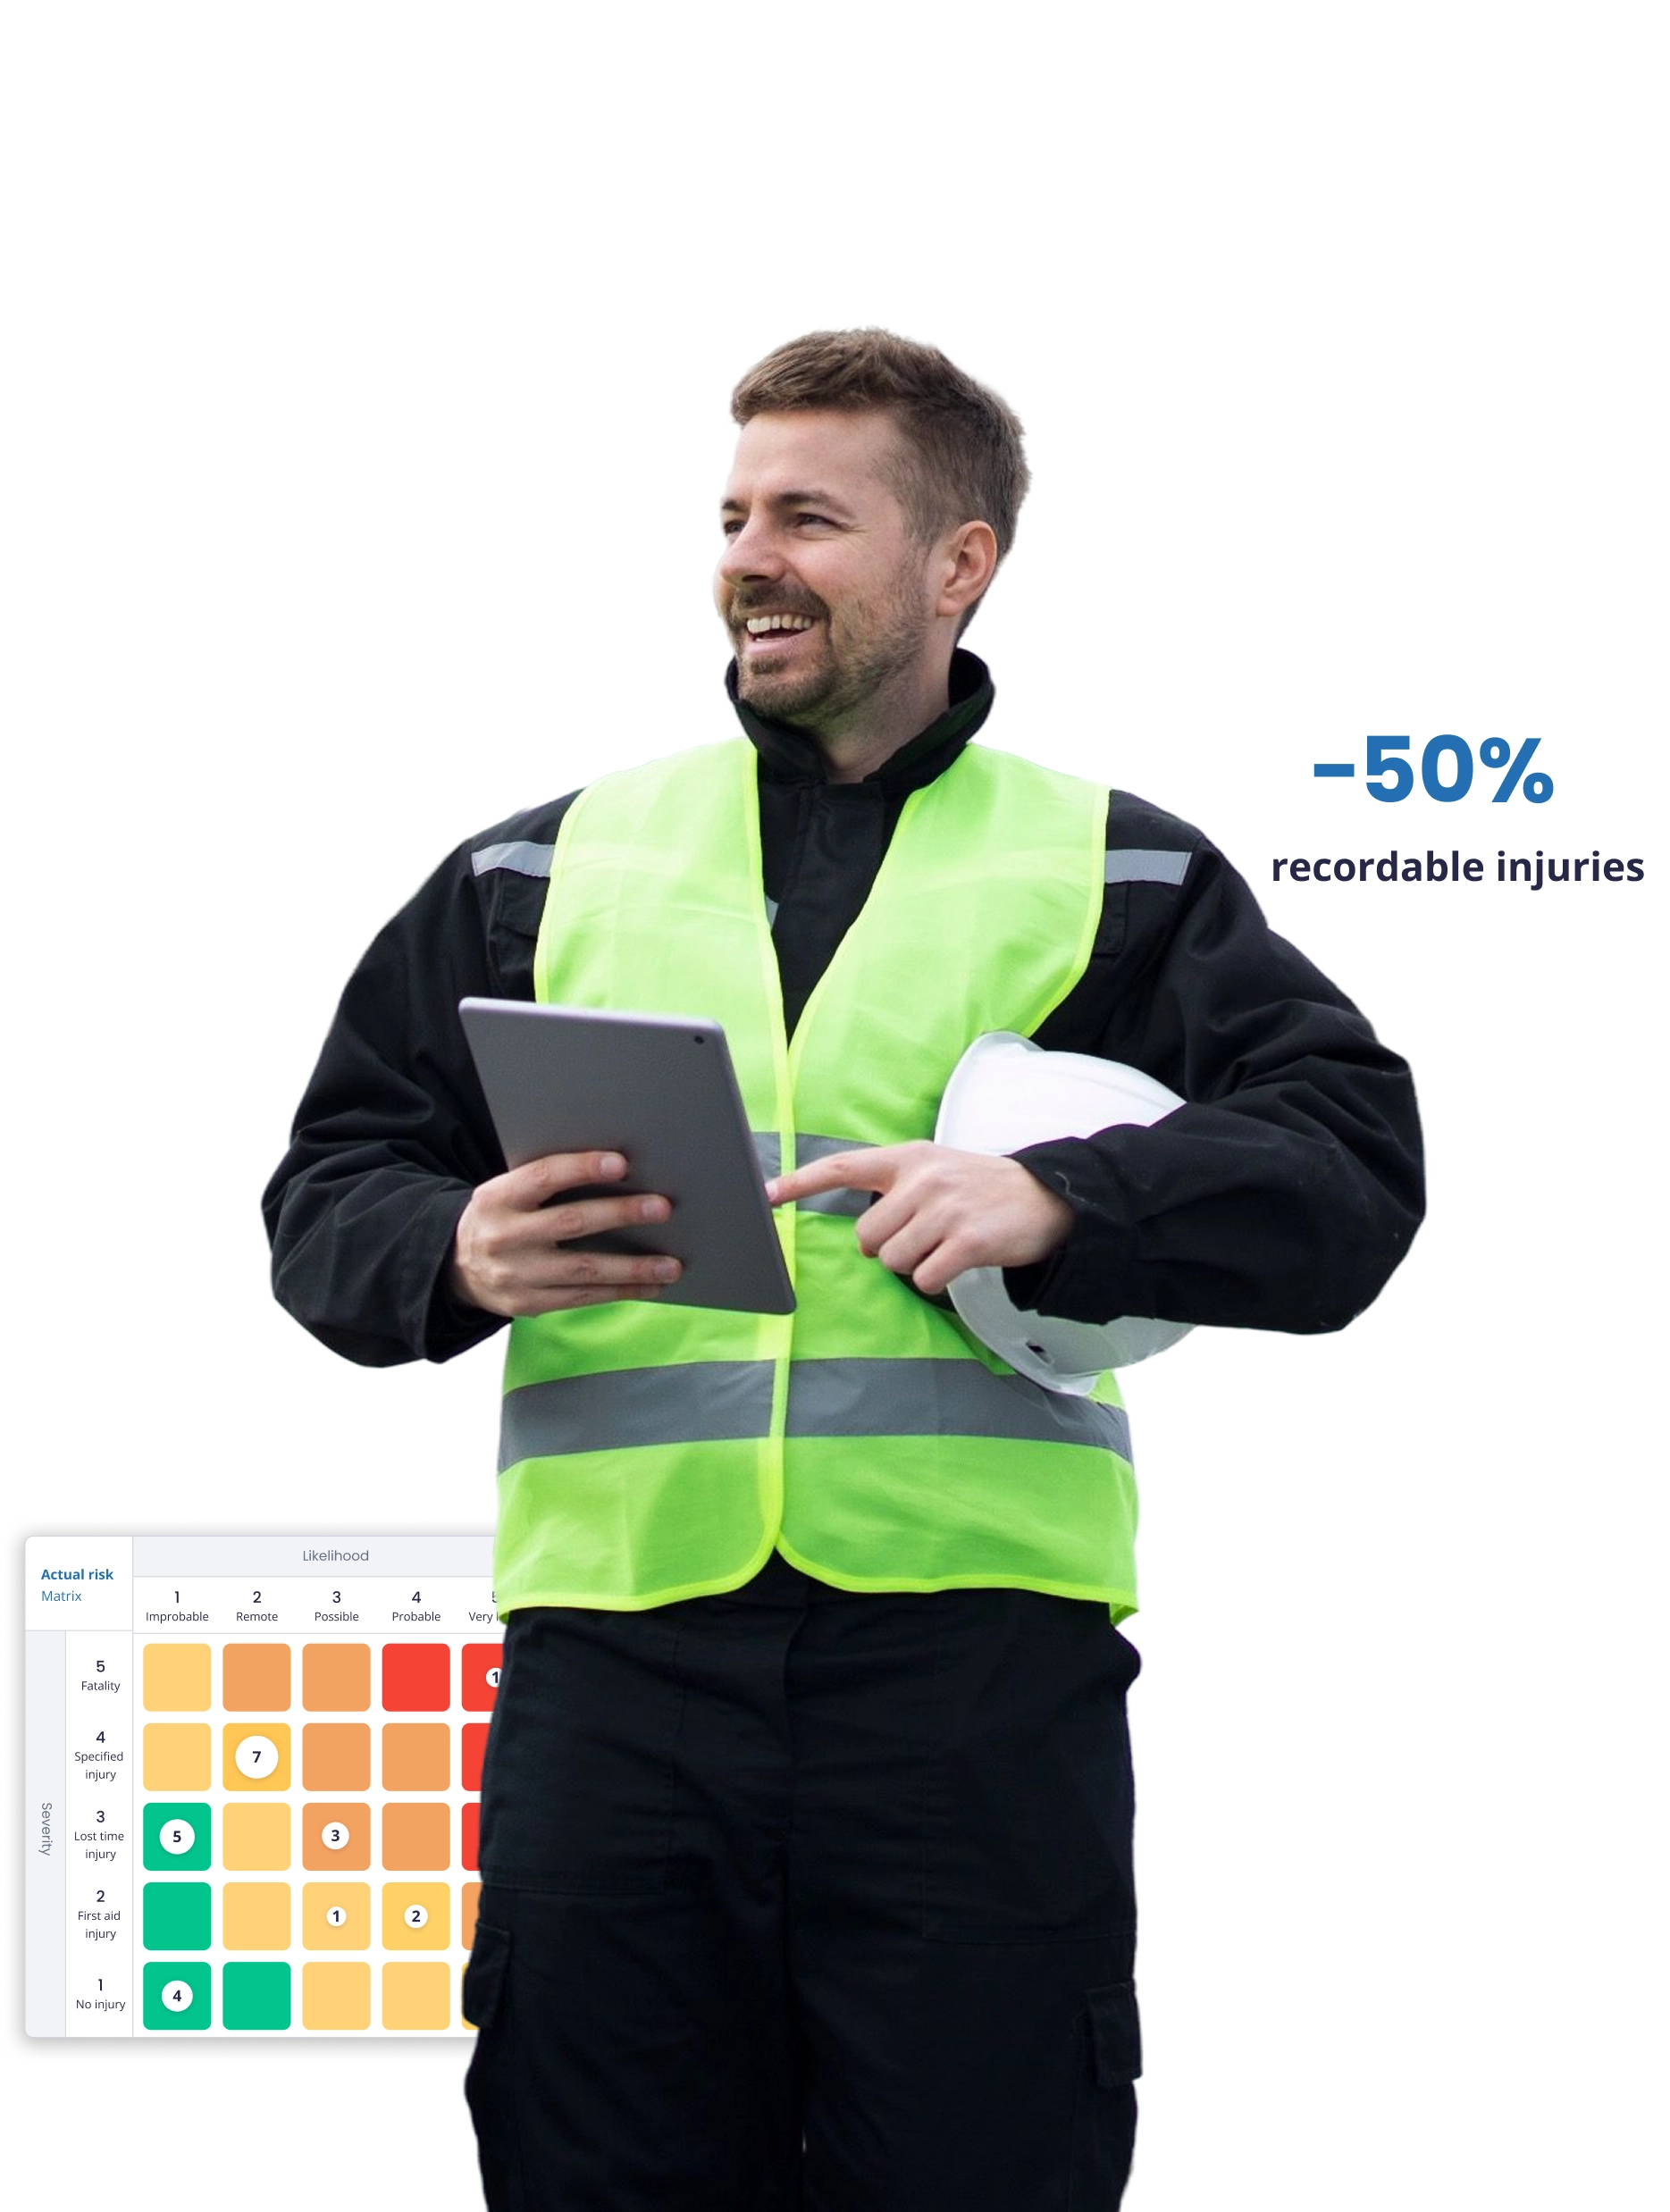
Smiling construction worker wearing a neon yellow safety vest and holding a tablet and white hard hat, with text stating '-50% recordable injuries' and a partially visible risk matrix chart.

Buyer's Guide: EHS Software

Verdantix recognises Glartek as an EHSQ provider that digitises frontline execution in high-risk industries, built for the people who actually use it. We are proud to be recognised here.

Why Glartek

What makes Glartek different

Built for adoption, not just compliance

Glartek works the way field teams work: simple, mobile-first, and reliable offline. When the frontline actually uses it, your data becomes an asset instead of a reporting exercise.
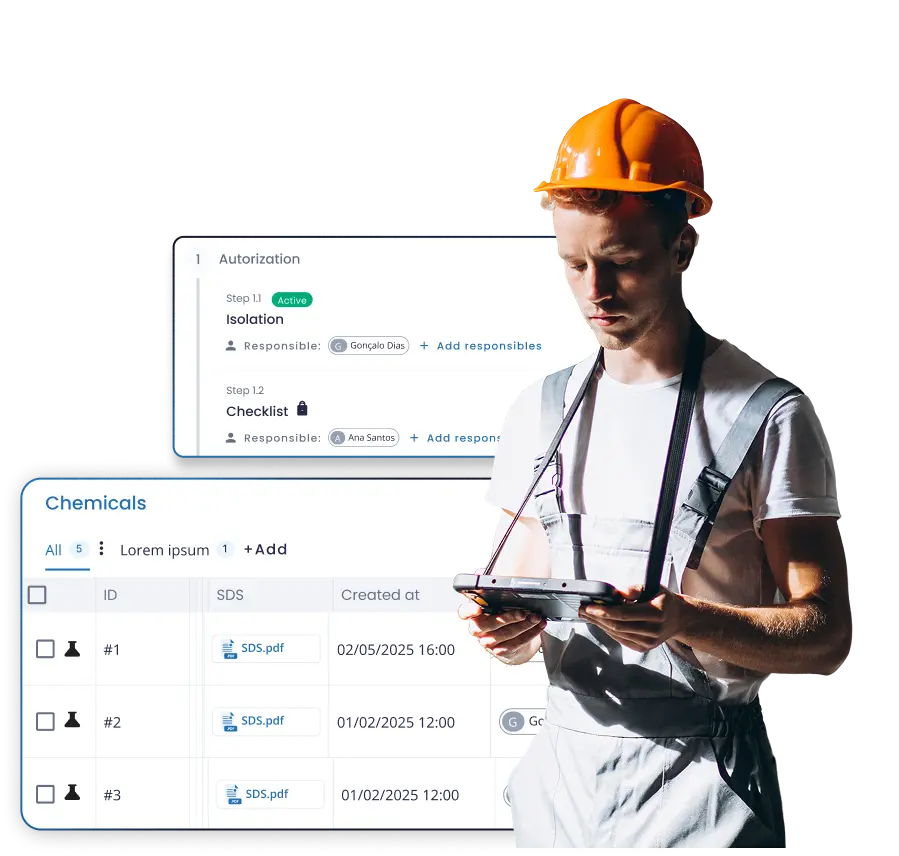
Man in orange hard hat and overalls using a tablet with overlay of chemical and authorization checklists.
AI that prevents, not just reports

Glartek's AI works inside the operational cycle. It pre-fills incident investigations, predicts serious injuries from leading indicators, and guides operators in the field. All in production, not on a roadmap.
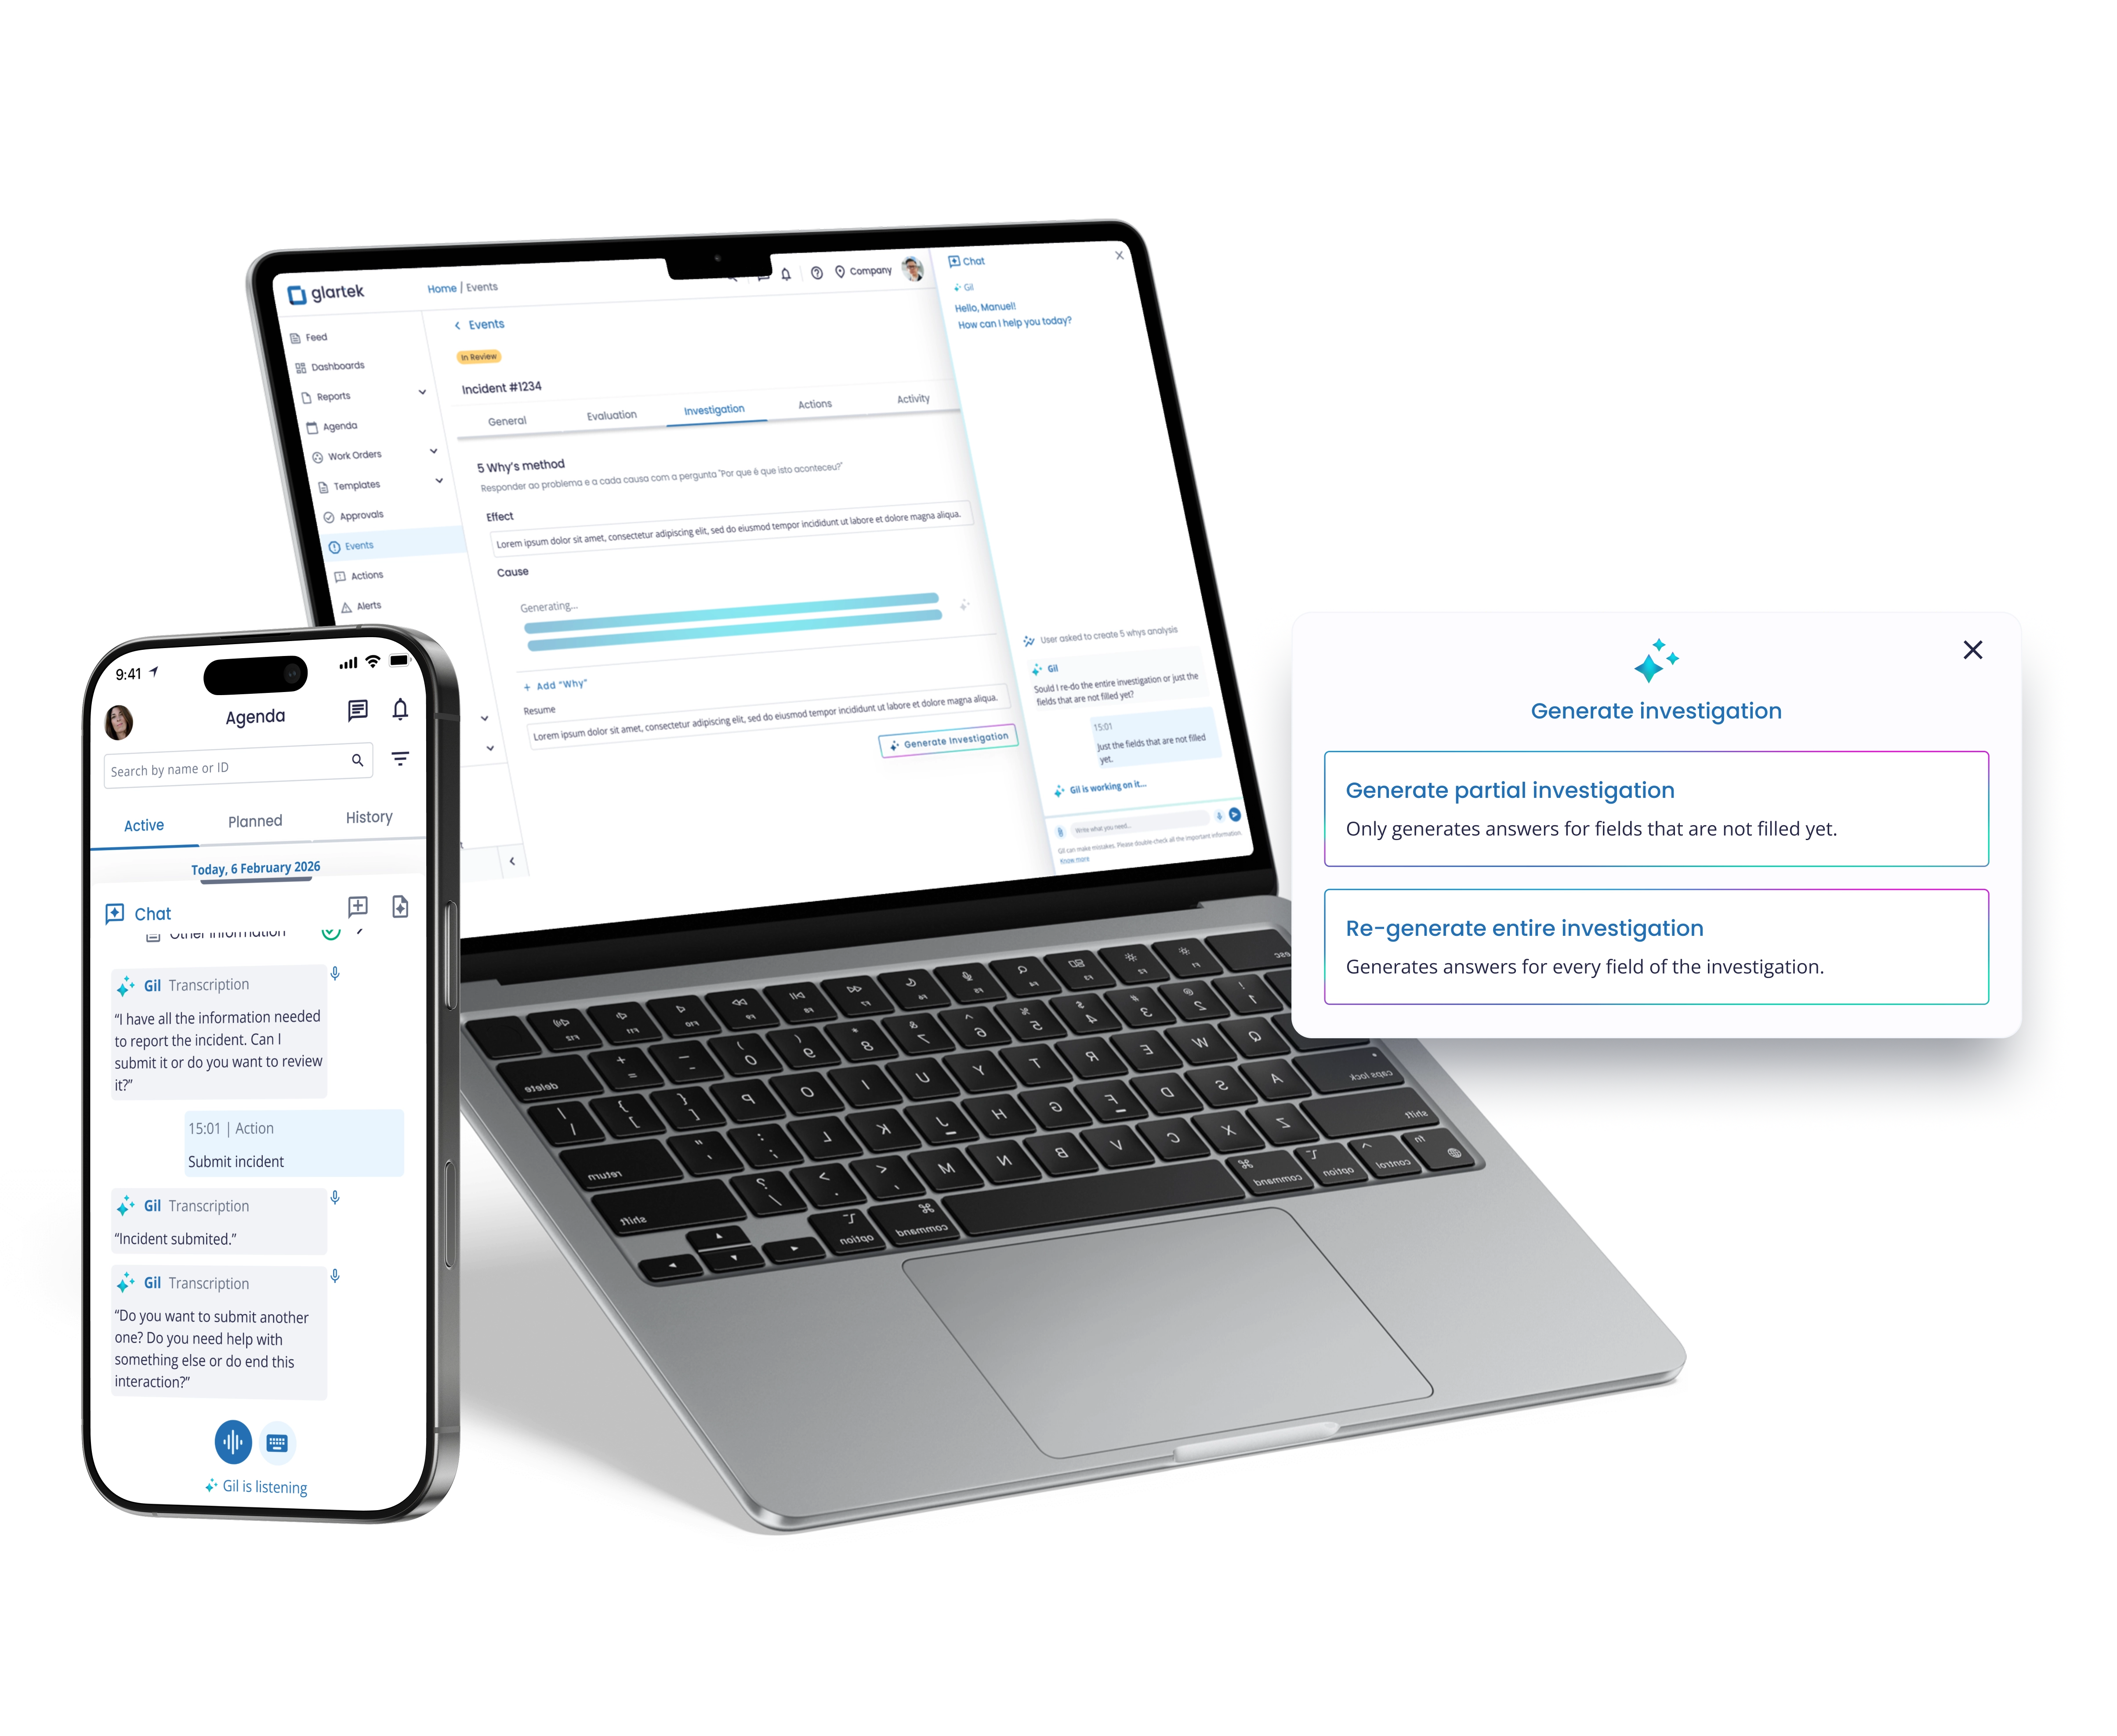
A laptop and a smartphone displaying a software interface for incident investigation and chat. The laptop screen shows an incident report using the 5 Why's method with sections like General, Evaluation, Investigation, Actions, and Activity, including a chat assistant named Gil. The smartphone screen shows an agenda with active tasks and a chat conversation with Gil discussing incident submission. A pop-up on the side offers options to generate a partial or entire investigation with AI assistance.
One platform, no gaps

Glartek was built natively from the ground up, not assembled through acquisitions. Every module shares the same data and the same experience, so there are no integration patches and no silos.
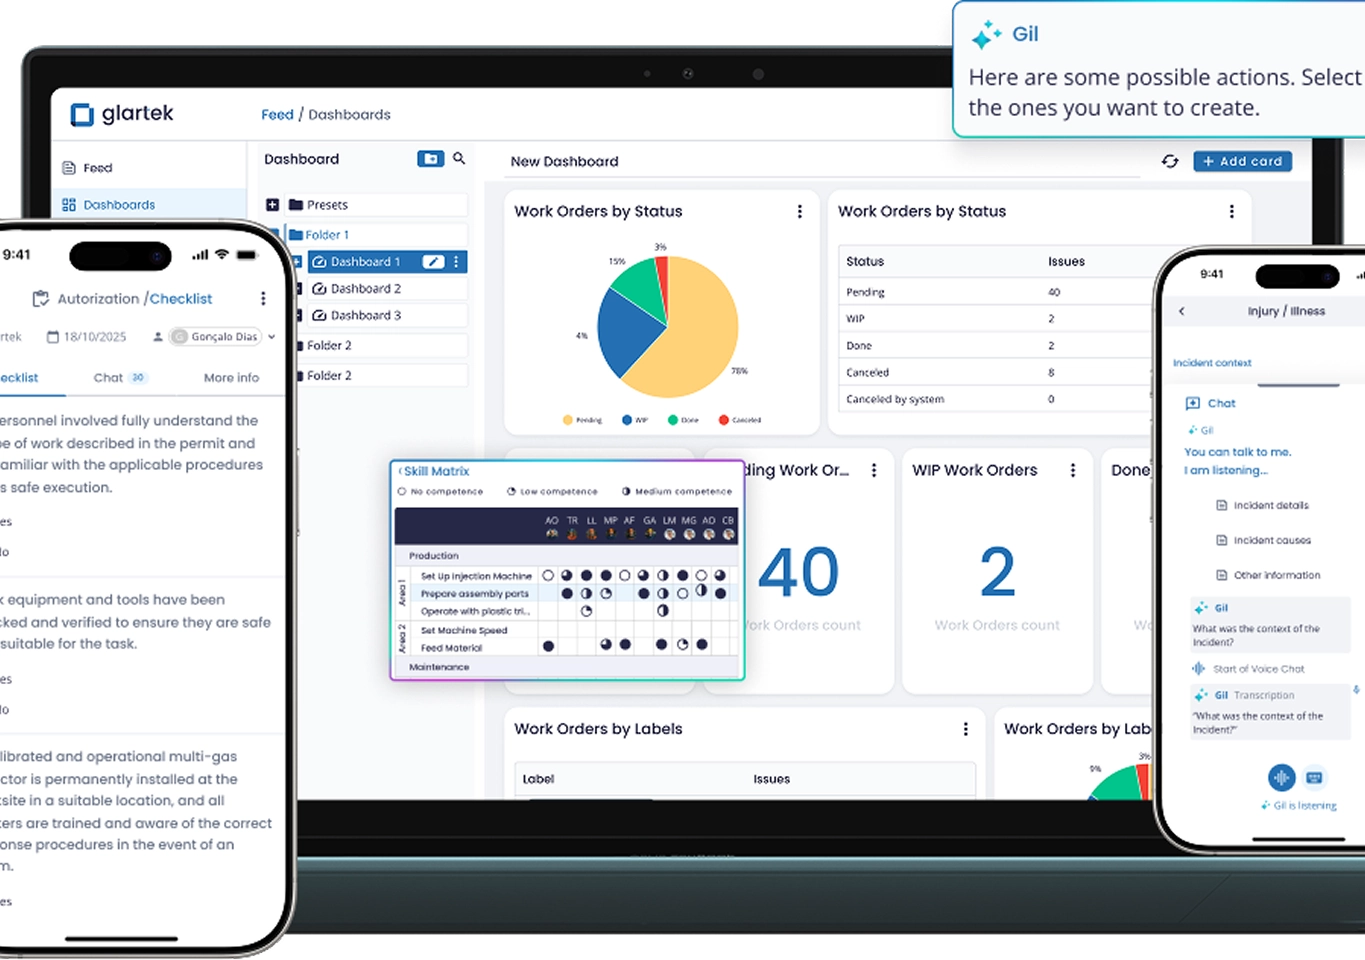
A laptop and two smartphones displaying the Glartek software interface with dashboards showing work orders status, skill matrix, chat conversations, and incident reports, including pie charts and data tables.
Live in weeks, configured by your team

No-code setup, no long consultancy projects. Your team configures Glartek and adapts it as needs change, with our support through the process and a TCO that fits real budgets.
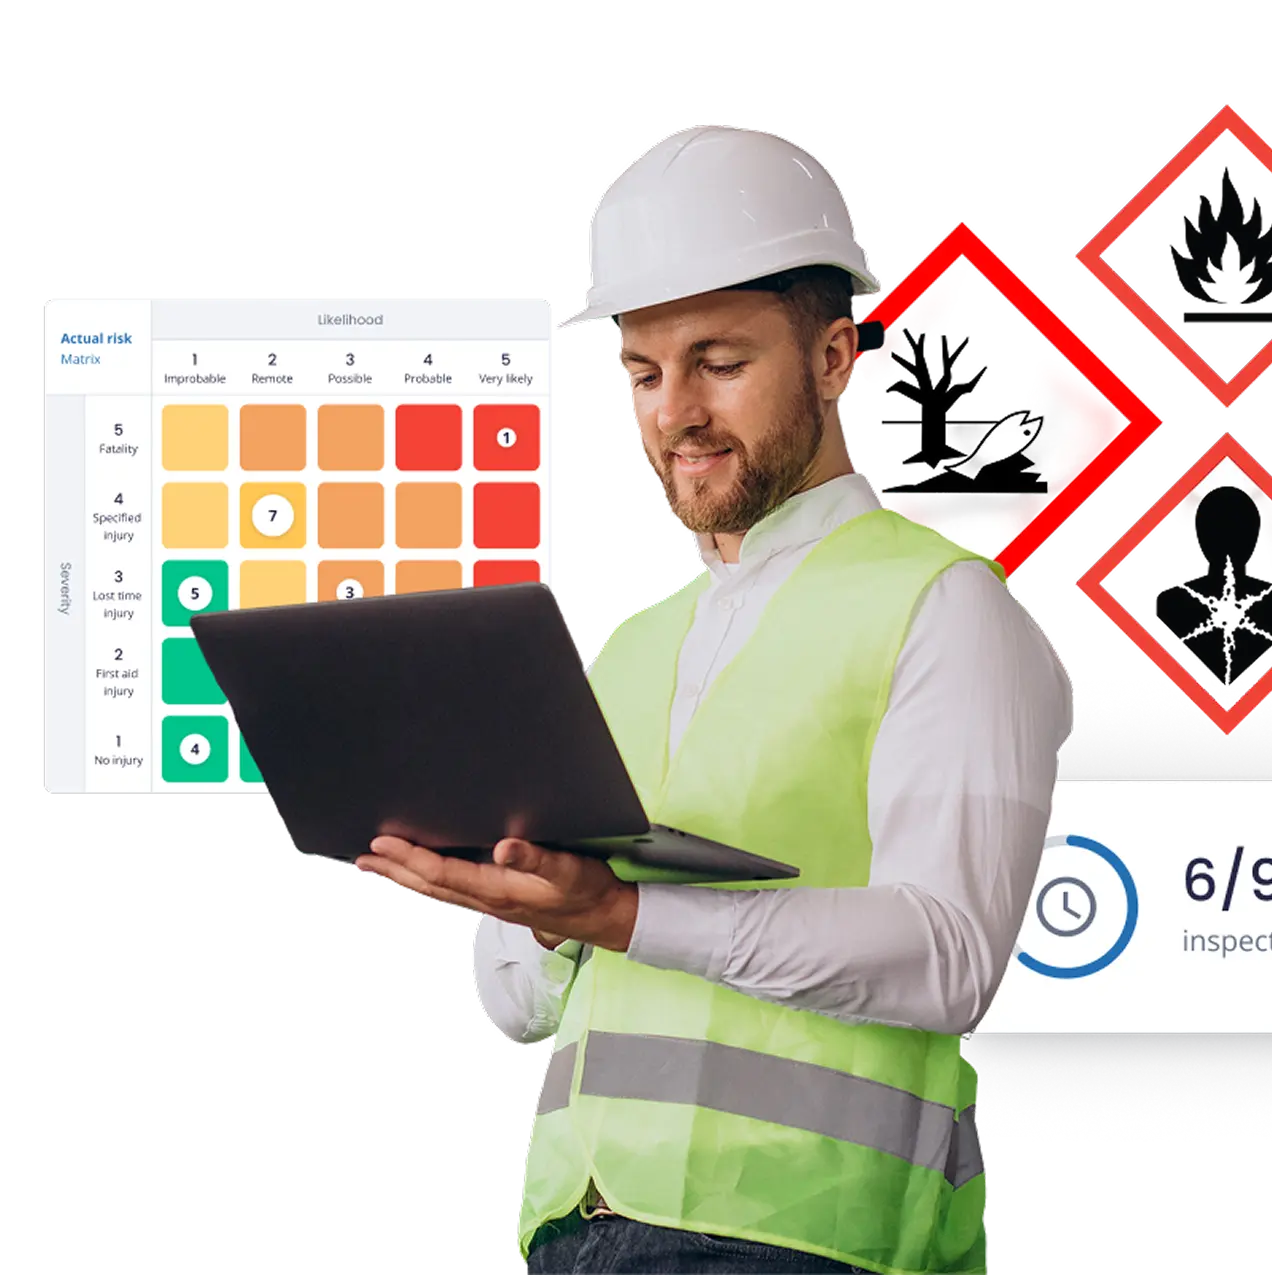
Man in white hard hat and yellow safety vest holding a laptop, standing in front of safety hazard symbols and a color-coded risk matrix chart.

Every incident avoided is a cost avoided

Proven impact  X Economics of prevention

77%

Fewer serious injuries & fatalities

91%

Corrective actions closed on time

52%

Less time preparing for audits

239%

ROI over 5 years with mature EHS software use

(Verdantix, 2022)

$ 4 - 6

Return per $1 invested in safety programmes

(OSHA)

The challenge

Understanding the industry context

€ 476 billion
a year

The cost of work-related accidents and illness for the EU, close to 3.3% of its GDP

Source: EU-OSHA/ILO
78%

of EHS leaders name increasing the use of leading indicators as a top priority
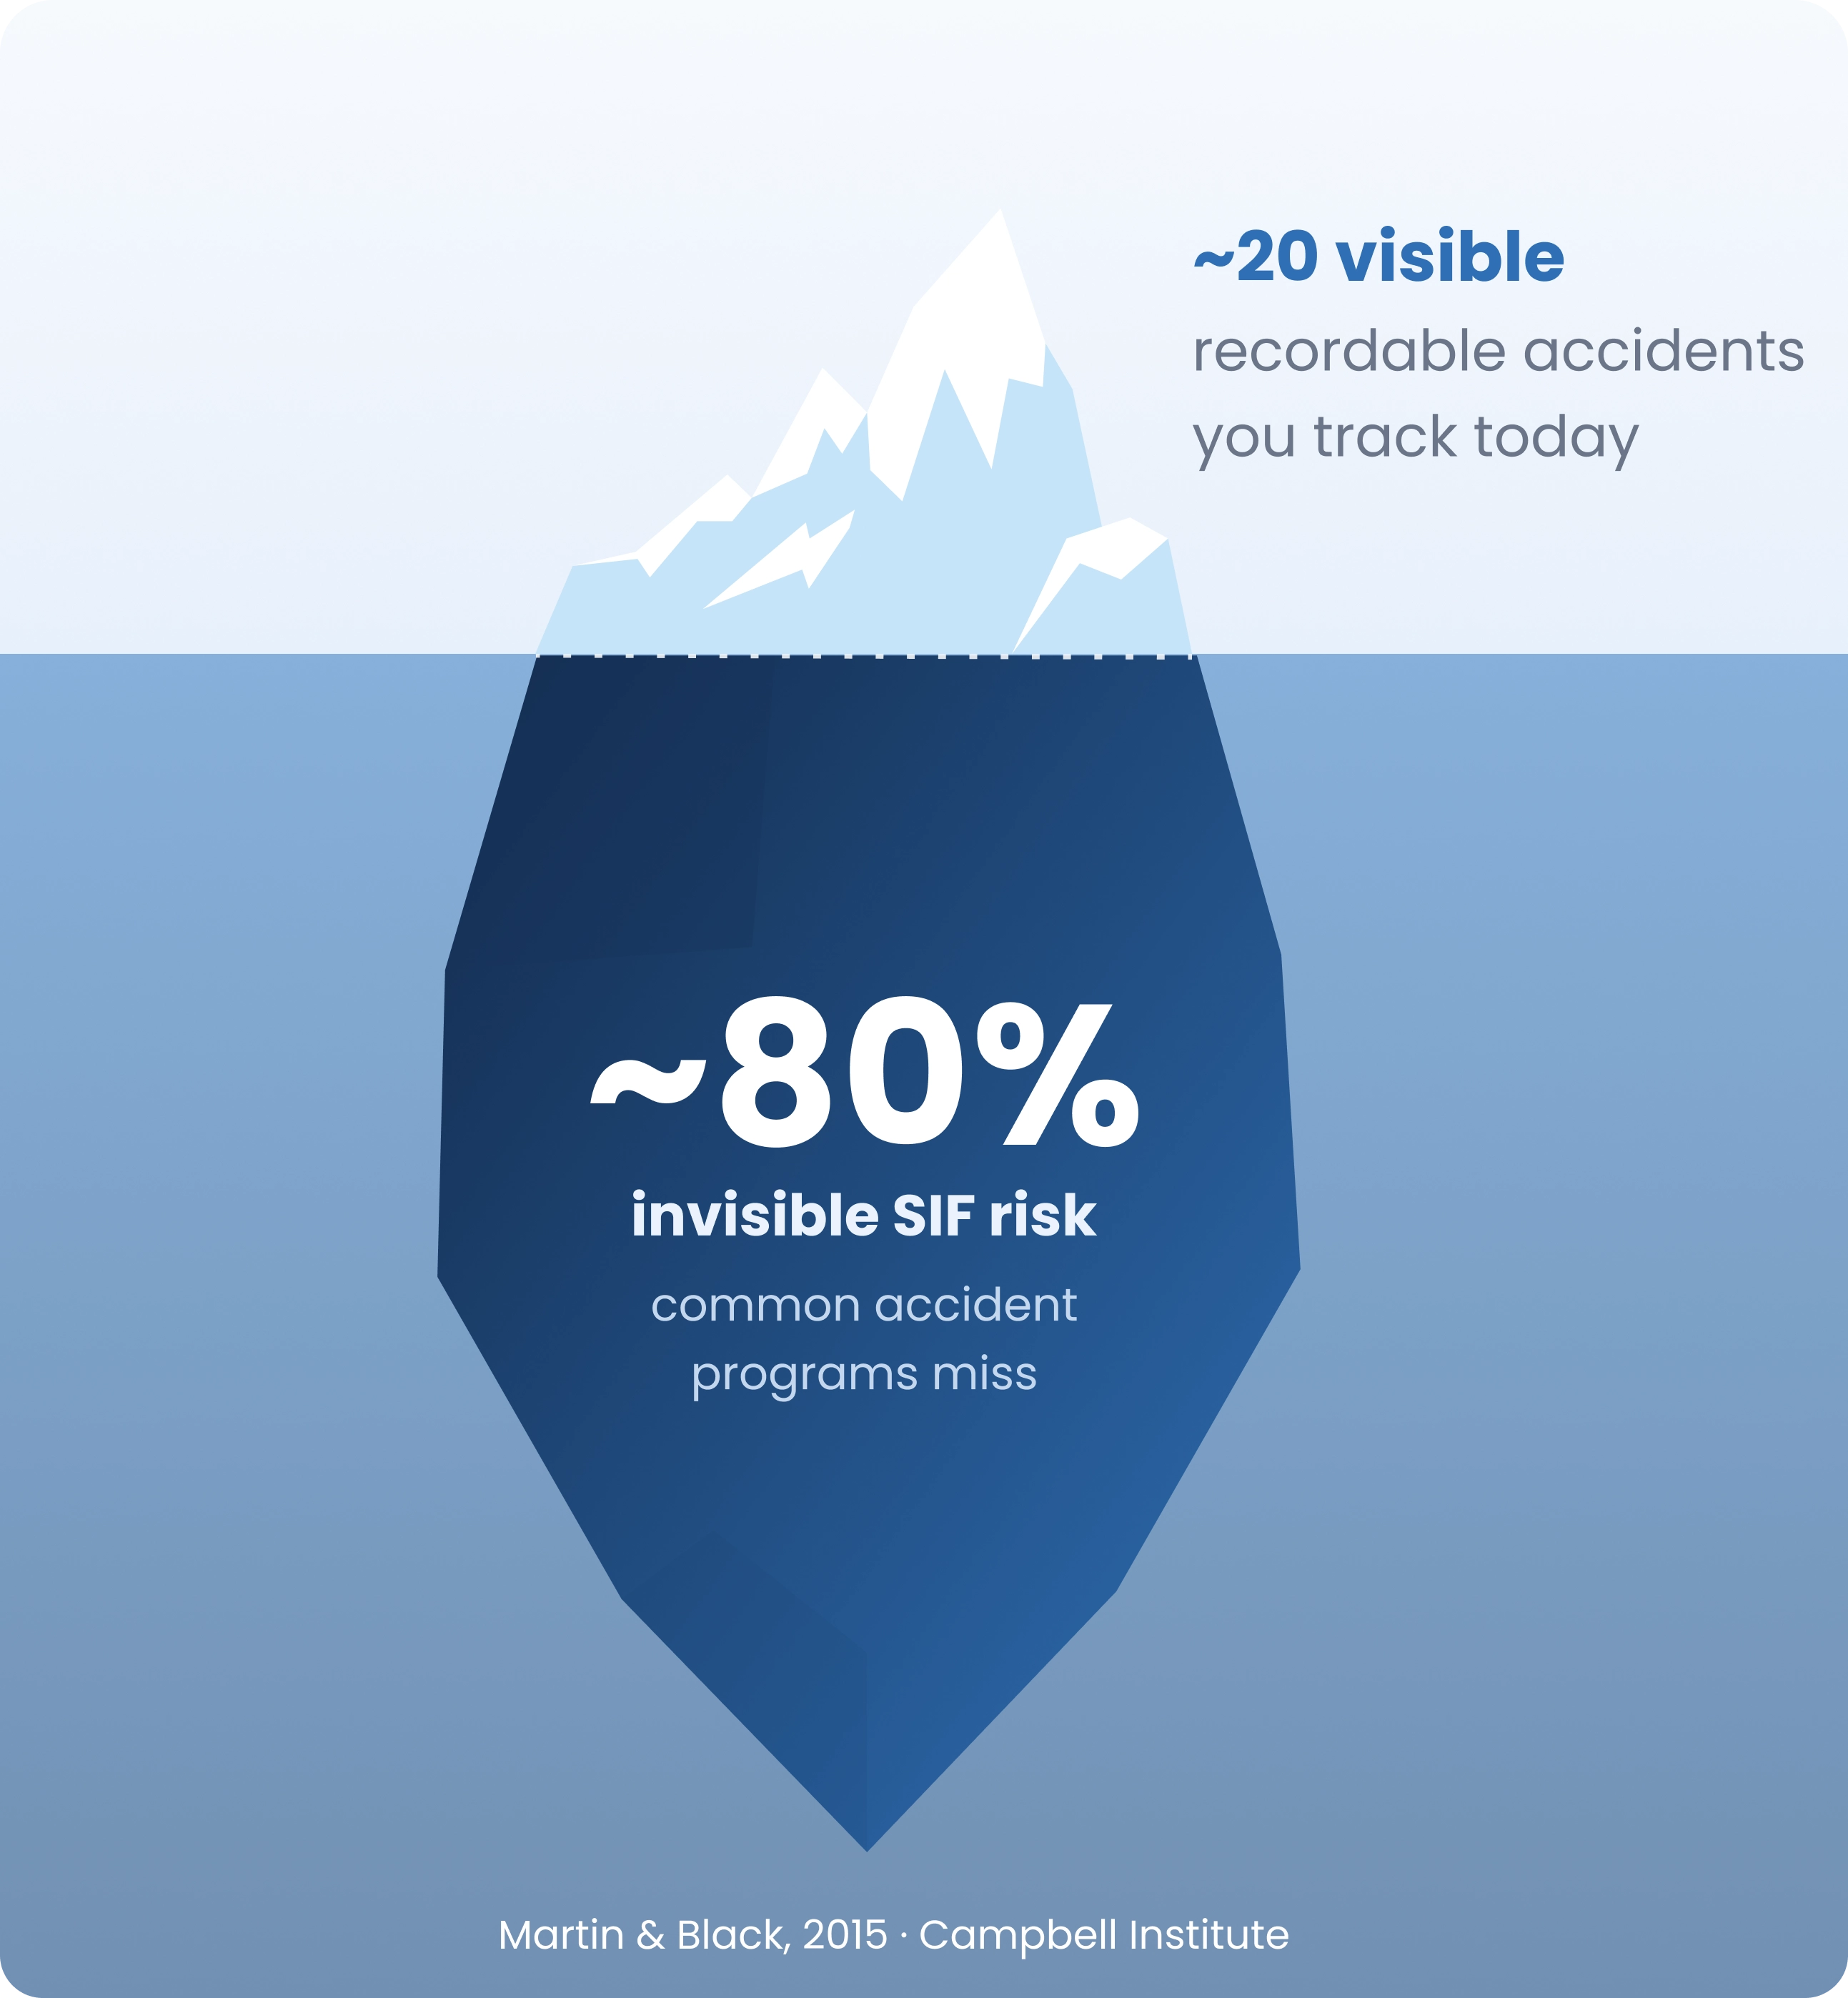
Source: Martin & Black, 2015 · Campbell Institute
Illustration of an iceberg depicting accident visibility: about 20% visible recordable accidents above water and about 80% invisible serious injury and fatality (SIF) risk below water that common accident programs miss.

What is EHSQ inefficiency costing you?
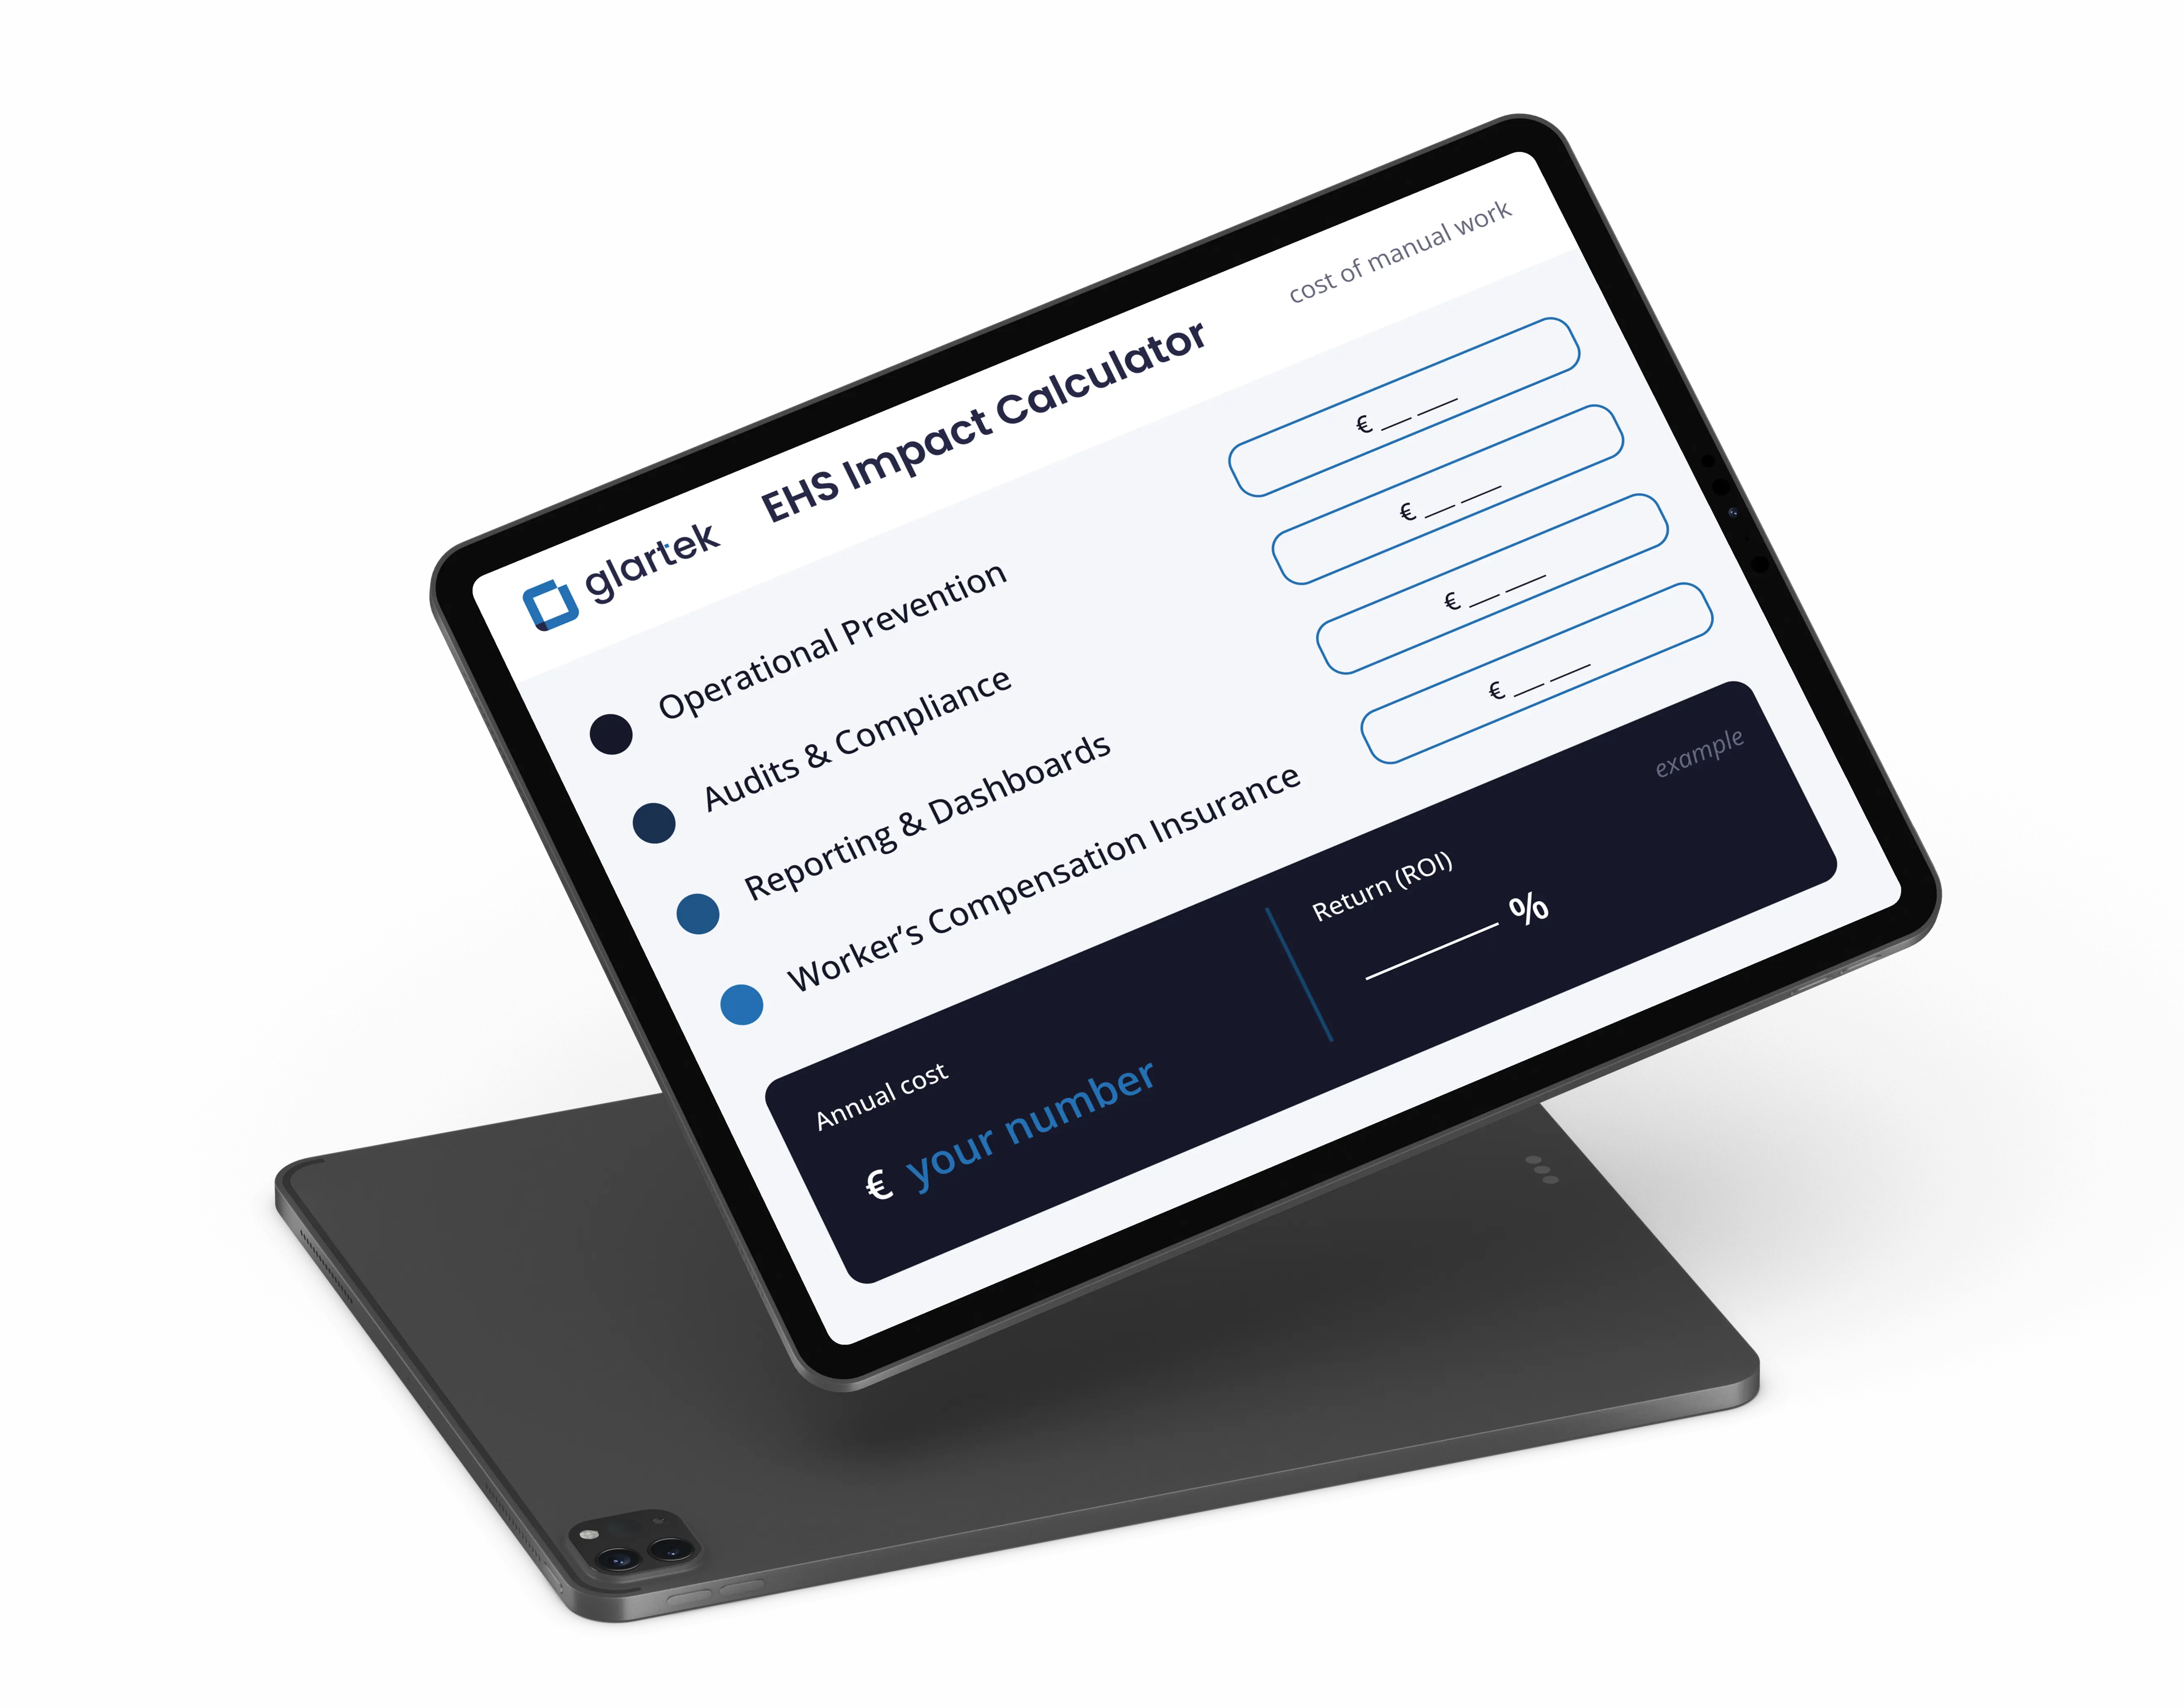
Calculate your EHSQ impact in just 2 minutes

Calculate your impact
Tablet screen displaying a glartek EHS Impact Calculator user interface with input fields for costs of manual work in categories: Operational Prevention, Audits & Compliance, Reporting & Dashboards, and Worker's Compensation Insurance, all in euros. The interface also shows sections for Annual Cost and Return on Investment (ROI) percentage.

Glartek closes the gap

Here is how you benefit

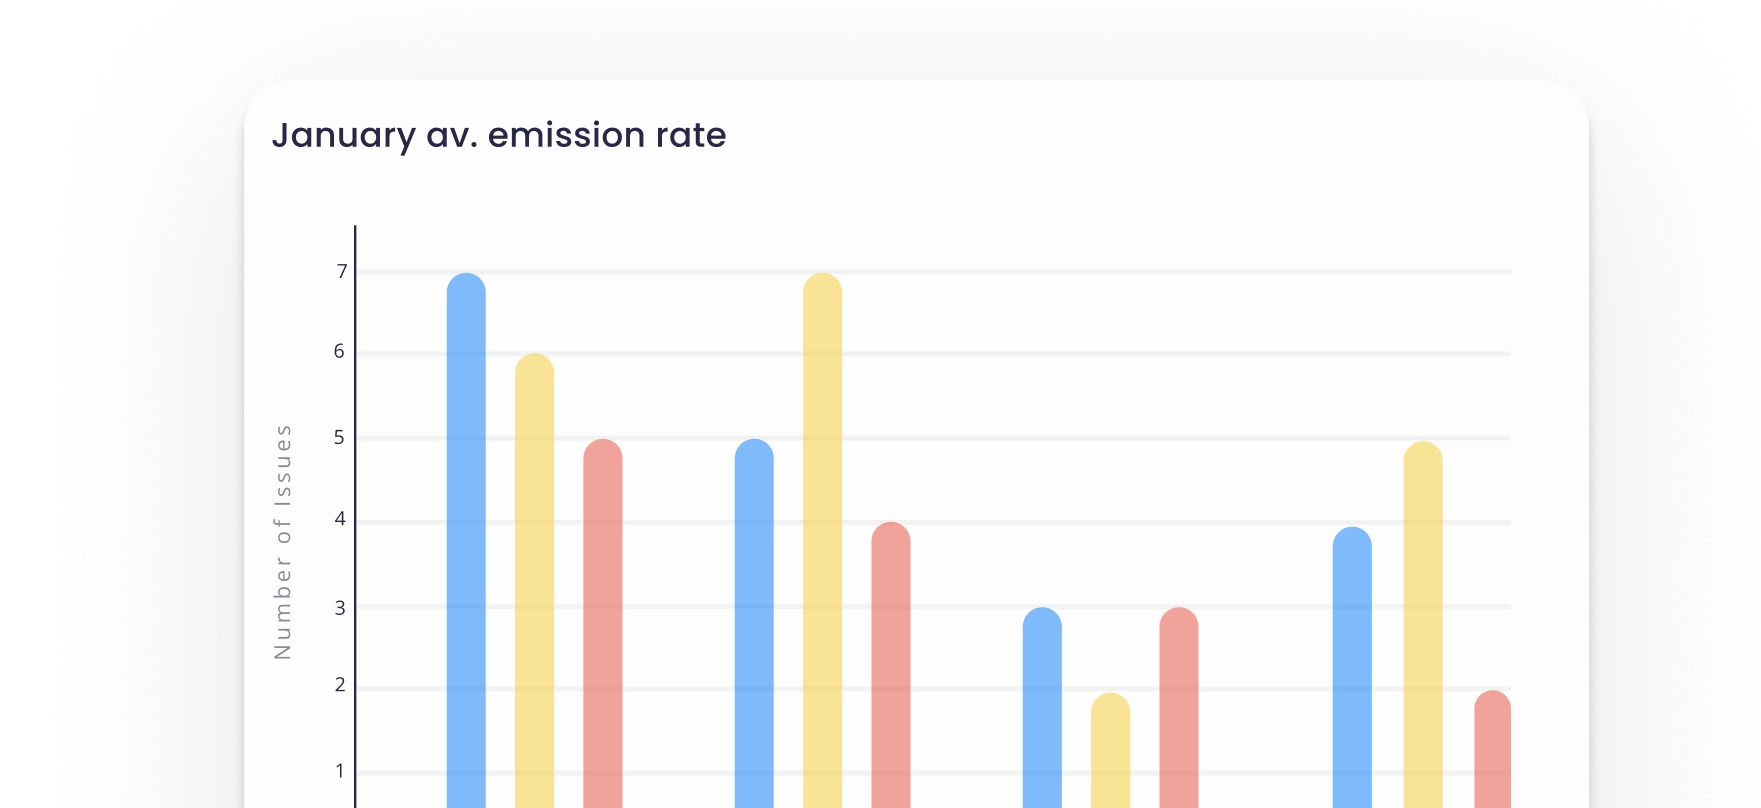
Bar chart titled 'January av. emission rate' showing number of issues on the vertical axis from 0 to 7. The chart has three colored bars for each category representing data: blue, yellow, and red bars with varying heights indicating emission rates between 1 and 7.
Increase your use of leading indicators

Move from tracking accidents that already happened to acting on the signals that predict them.
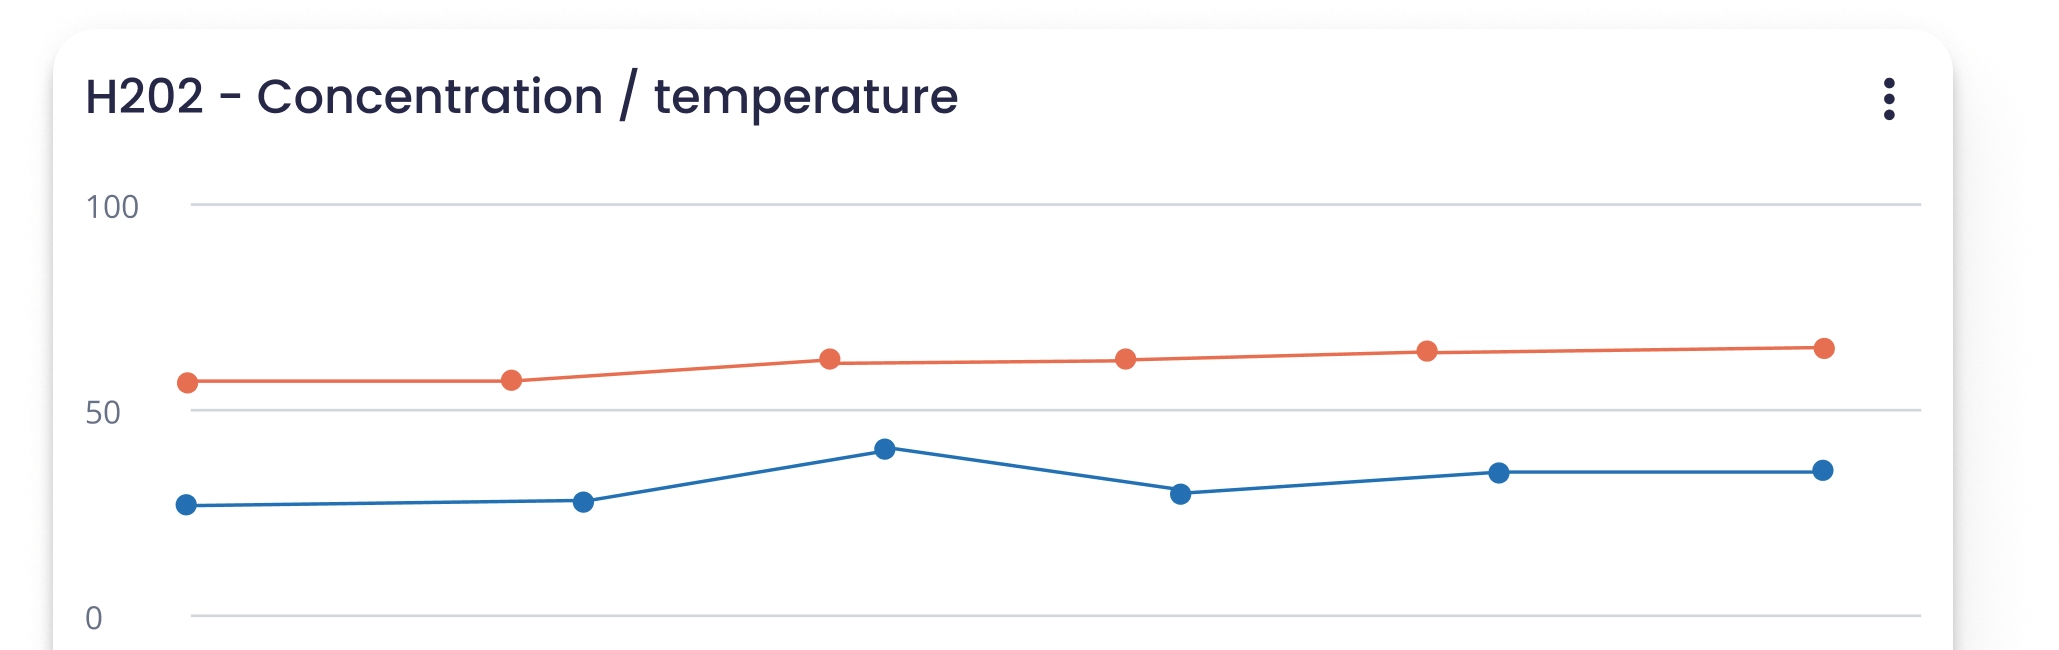
Line graph titled 'H2O2 - Concentration / temperature' showing two data series with values ranging from 0 to 100 on the vertical axis; one series in orange starts around 58 and shows a slight upward trend, the second series in blue starts around 28, peaks near 40, then fluctuates around 35.
Predict and prevent SIFs

Act on leading indicators before an incident escalates into a serious injury or fatality.
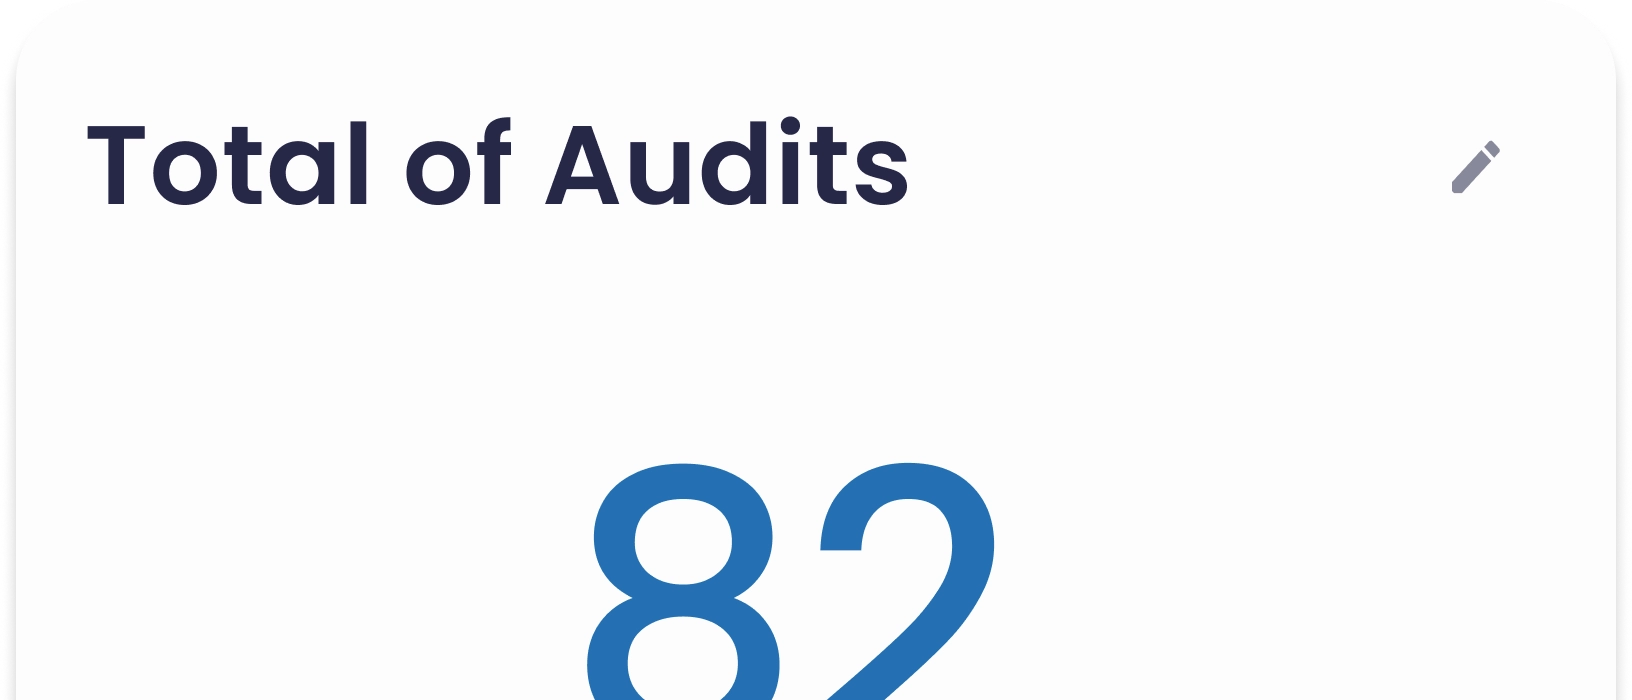
Dashboard card titled Total of Audits showing the number 82 in large blue text.
Act on real-time field data

Field activity and performance trends in a single live view, captured at the point of work.
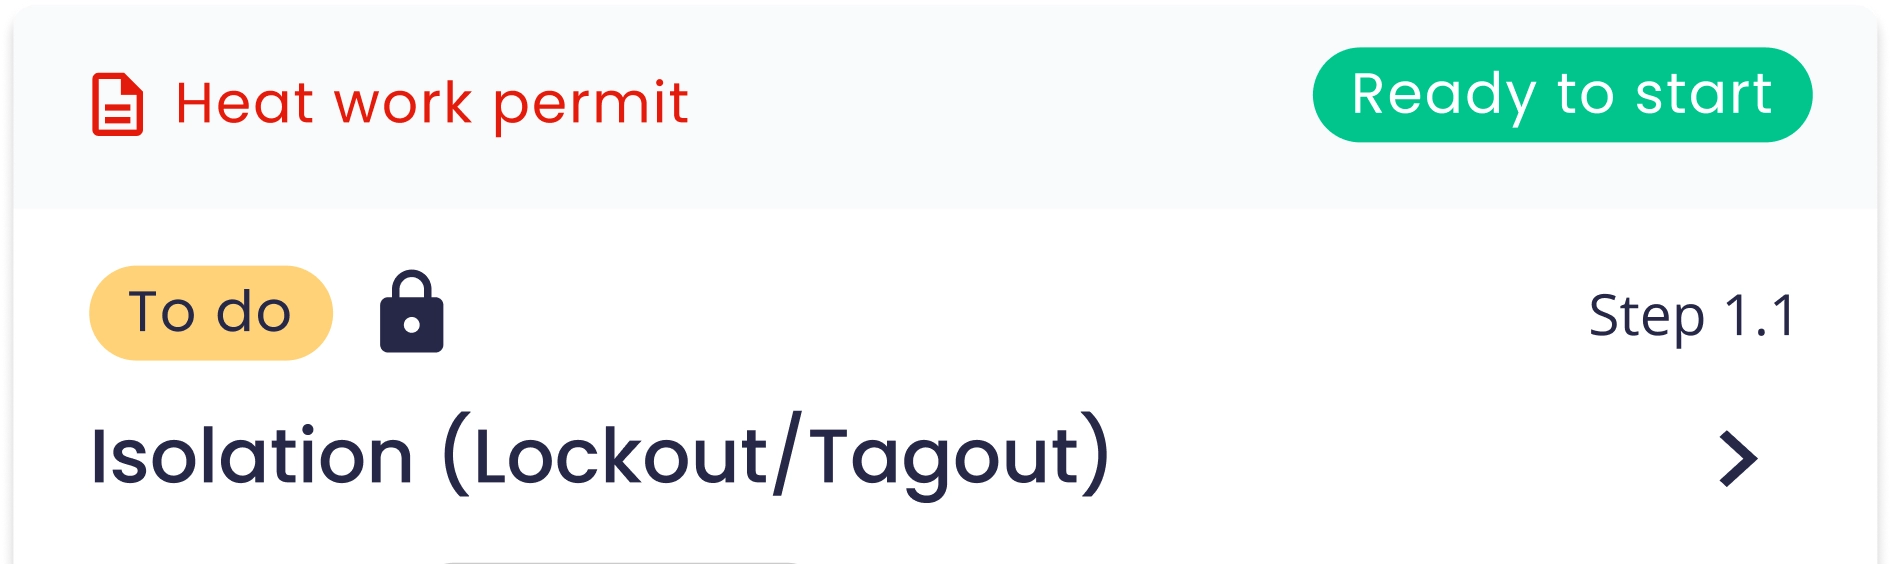
Heat work permit section labeled 'To do' and locked with text 'Isolation (Lockout/Tagout)' under Step 1.1, with a green button labeled 'Ready to start'.
Eradicate paper and legacy systems

Digitise permits, inspections and procedures, and keep them working offline.
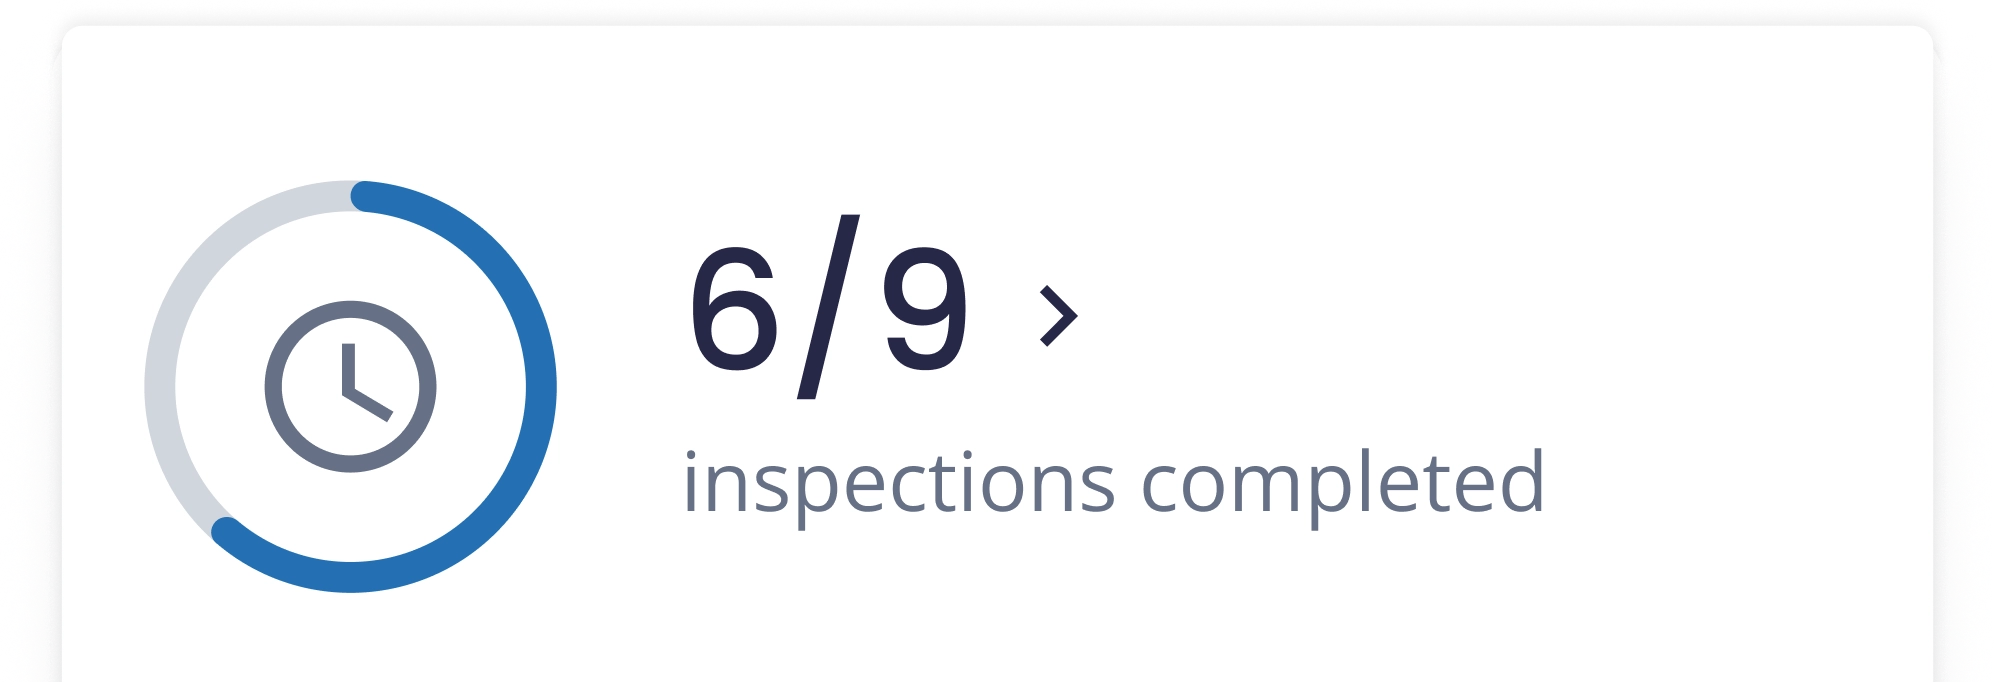
Progress circle partially filled indicating 6 out of 9 inspections completed, with a clock icon inside the circle.
Run EHS and Quality in one flow

The same operator logs a safety near-miss and a quality non-conformity in the same app, with one CAPA lifecycle.
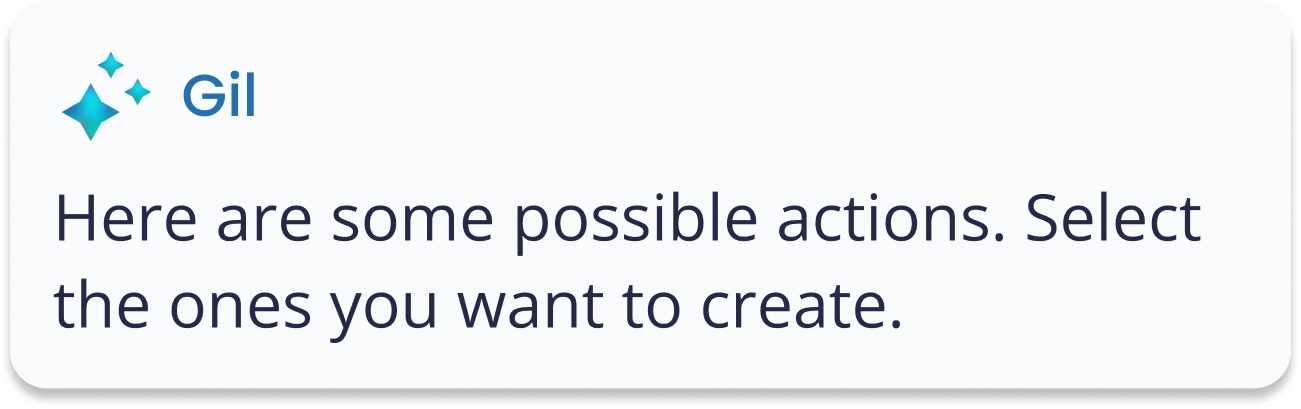
Chat message from Gil with a sparkle icon, saying: Here are some possible actions. Select the ones you want to create.
Three stylized blue and turquoise glowing star shapes with subtle purple accents, arranged in a cluster.
AI-native

AI pre-fills investigations, drafts CAPAs and guides the field. In production, using the data you already capture.

Trusted by industry leaders

Results from the field

Finerge company name in bold green letters on a transparent background.
"Glartek’s solution has been an asset to our operations and to our daily needs, both in terms of control and response efficiency. ”
Isaías Ribeiro · Maintenance Management · Finerge
27%
decrease in asset downtime
35%
faster decision making
Secil logo with stylized yellow circular arcs surrounding bold black text.
"100% of LOTOTO procedures were executed correctly without the need for correction."
Sónia Frade · Digital and Legal Safety Coordinator · Secil
15%
faster execution times
20%
faster training
Plastic Energy company logo with a stylized drop symbol and text on black background.
"Now we have real-time guidance supported by digital tools increasing workers’ autonomy leading to greater productivity and efficiency.”
María Sánchez · Process Engineering · Plastic Energy
84%
successful execution rate
0%
frontline workers error rate

Not all EHSQ platforms are built the same

Key Areas
Glartek
Other EHSQ software
Platform foundation

Built natively from day one. One codebase, one consistent experience across every module.

Often assembled through acquisitions, leaving inconsistent experiences and patchy data flows.

Frontline adoption

Designed mobile-first for field operators and reliable offline, so the frontline actually uses it.

Primarily back-office tools, with a mobile app added later as an afterthought.

AI in operations

AI embedded in the operational cycle: risk assessment, incident investigation, CAPA and SIF prediction.

AI limited to reporting dashboards, with no intelligence at the point of work.

Time to value

Live in weeks. No-code setup your team can own, with our support alongside you whenever you want it.

Implementations that run from 6 to 18 months and depend on consultants.

Client autonomy

Configure, adapt and expand on your own, or lean on our team. You decide how much you take on and how much we handle.

A rigid model: most changes require the vendor or a systems integrator, whether you want that or not.

Data integrity

A single source of truth, so field data and management data stay in sync.

Manual integrations that create lag and inconsistencies between systems.

Works with your stack

Integrations

Frequently Asked Questions

What is Glartek?
What makes Glartek different from other EHSQ software?
Which industries does Glartek serve?
What does Glartek cover?
What makes field teams actually use Glartek?
How does Glartek's AI work?
Why does it matter that Glartek is built natively rather than assembled through acquisitions?
How quickly can we go live, and do we need consultants?
Can we run Safety and Quality in one platform?
How does Glartek help prevent serious injuries and fatalities?
How do we get started?