Root cause analysis (RCA) is the structured process of identifying the fundamental system failure behind an incident, nonconformity or deviation, so that this cause can be eliminated and the problem prevented from happening again, rather than only fixing the visible symptom.
Root cause analysis, commonly known by its acronym RCA, is a set of methods used to uncover the underlying reason a problem occurred. Instead of reacting to what is visible on the surface, RCA looks for the system failure that, if left uncorrected, will let the same problem happen again.
The reference definition comes from OSHA, the occupational safety and health agency in the United States: "a root cause is a fundamental, underlying, system-related reason why an incident occurred that identifies one or more correctable system failures." The American Society for Quality (ASQ) adds the quality perspective, describing RCA as "a collective term that describes a wide range of approaches, tools, and techniques used to uncover causes of problems."
In regulatory terms, RCA is the engine of improvement. ISO 45001:2018, in clause 10.2, requires that, following an incident or nonconformity, the organisation evaluate the need for action to eliminate the root cause so the event does not recur. Across Europe, the OSH Framework Directive (89/391/EEC) obliges employers to keep records and draw up reports on occupational accidents, and in the UK, RIDDOR 2013, enforced by the HSE, sets out which incidents must be reported and recorded. In every case, the legal duty is not met by a quick fix: it demands reaching the origin.
A problem treated only at the surface comes back. Root cause analysis is what separates an organisation that fights fires from one that learns from every event. Its value, however, reads differently depending on who is looking.
Every recurring incident is an investigation that never finished. RCA turns scattered reports into actionable conclusions: it identifies the barrier that failed, generates a corrective action with an owner and a deadline, and produces the structured evidence an ISO 45001 auditor will ask for. Without a documented root cause, a corrective action is an opinion; with one, it is a verifiable control.
The cost of an incident rarely shows up in the shift report. According to the National Safety Council's Injury Facts, the average cost of a medically consulted work injury was estimated at 48,000 US dollars and a work-related death at 1.54 million US dollars (2024 data). The total cost of work injuries in the United States was estimated at 181.4 billion US dollars that year. An RCA that eliminates the origin of an event avoids repeating the cost, and repetition is where the money piles up.
A culture that seeks the right root cause is a culture that does not seek someone to blame. When the organisation shows it investigates systems rather than people, field teams report more and hide less. That feeds the virtuous cycle: more quality data, better analysis, fewer events. The opposite, blaming the operator, dries up the very source of information the analysis depends on.
A sound investigation starts by separating levels of cause. Mistaking the immediate cause for the root cause is the most common and most expensive error, because it leads to actions that treat the symptom and leave the origin untouched.
Fixing only the immediate cause replaces the seal and restarts the pump. The same failure returns within months. Acting on the root cause creates the preventive maintenance plan that stops the next leak across the whole fleet of similar pumps. It is the difference between patching and solving.
When an investigation ends at "operator error", it almost always stopped too soon. The modern approach, closely tied to the work of psychologist James Reason, distinguishes two kinds of failure. Active failures are the unsafe acts of those at the operational sharp end, with immediate effect. Latent conditions are dormant weaknesses created upstream, by decisions about design, procedures, resourcing or culture, which lie hidden until they align with an active failure.
The Swiss cheese model illustrates the idea: each layer of defence is a slice of cheese, and each slice has holes, which are its weaknesses. An accident happens when the holes in several layers line up and let the trajectory of harm pass through. The lesson for RCA is direct: human error is usually the last hole, not the origin. The root cause most often lies in the system's latent conditions, which is why OSHA itself prefers to speak of correctable system failures rather than individual blame.
There is no single method of root cause analysis. There is a toolbox, and the skill lies in choosing the right tool for each problem. These are the methods most used in the EHSQ world.
Asking "why?" repeatedly, feeding each answer into the next question, until you reach the system failure. It was born in the Toyota Production System, with Sakichi Toyoda and Taiichi Ohno. It is fast, requires no statistics and works well for problems with a likely single cause. The risk is stopping at a symptom or following a single line of reasoning when the event has several causes.
A cause-and-effect diagram that organises possible causes into categories, typically the 6Ms: method, machine, material, manpower, measurement and mother nature (environment). Created by Kaoru Ishikawa, it is ideal for structured team brainstorming, because it prevents fixation on a single cause and forces the team to look at every dimension. It neither ranks nor quantifies: it lists hypotheses that still need to be verified against data.
A deductive, top-down method: it starts from an undesired top event and works down through logic gates (AND / OR) to the elementary failures that, combined, cause it. Developed at Bell Labs in 1962, it is the right tool for complex systems and for events that occur only when several failures coincide, and it even supports quantitative analysis. In return, it is labour-intensive and requires probability data.
An inductive, bottom-up method that walks through each possible failure mode and prioritises it with a risk priority number (RPN), the product of severity, occurrence and detection. It is proactive by nature: used to anticipate failures in designs (DFMEA) and processes (PFMEA) before they happen. The RPN deserves caution, because multiplication can mask high-severity, low-frequency risks.
A bar chart ordered by frequency or cost that highlights the "vital few": the handful of problem types responsible for most of the effects. It rests on Vilfredo Pareto's 80/20 principle, popularised by Joseph Juran. It explains the why of nothing, but it answers an essential question before the RCA: where to start when many problems compete for attention.
Barrier analysis asks which controls should have prevented or detected the event and which ones failed. The bowtie diagram takes the idea further: it places the top event at the centre, threats and preventive barriers on the left, and consequences and mitigation barriers on the right. It is particularly strong in process safety and aligns well with the control logic of ISO 45001.
The biggest mistake is not applying a method poorly, it is applying the wrong method to the problem. This table crosses the variables that really drive the choice: complexity of the event, time available, need for data and type of reasoning.
.webp)
In practice, the methods combine. A Pareto analysis picks the problem, an Ishikawa diagram raises the hypotheses, the 5 whys deepen the most promising line, and barrier analysis confirms which control failed. The tool serves the investigation, not the other way around.
Whatever the method, a well-run RCA follows a sequence. Skipping steps is the fastest route to a wrong conclusion.
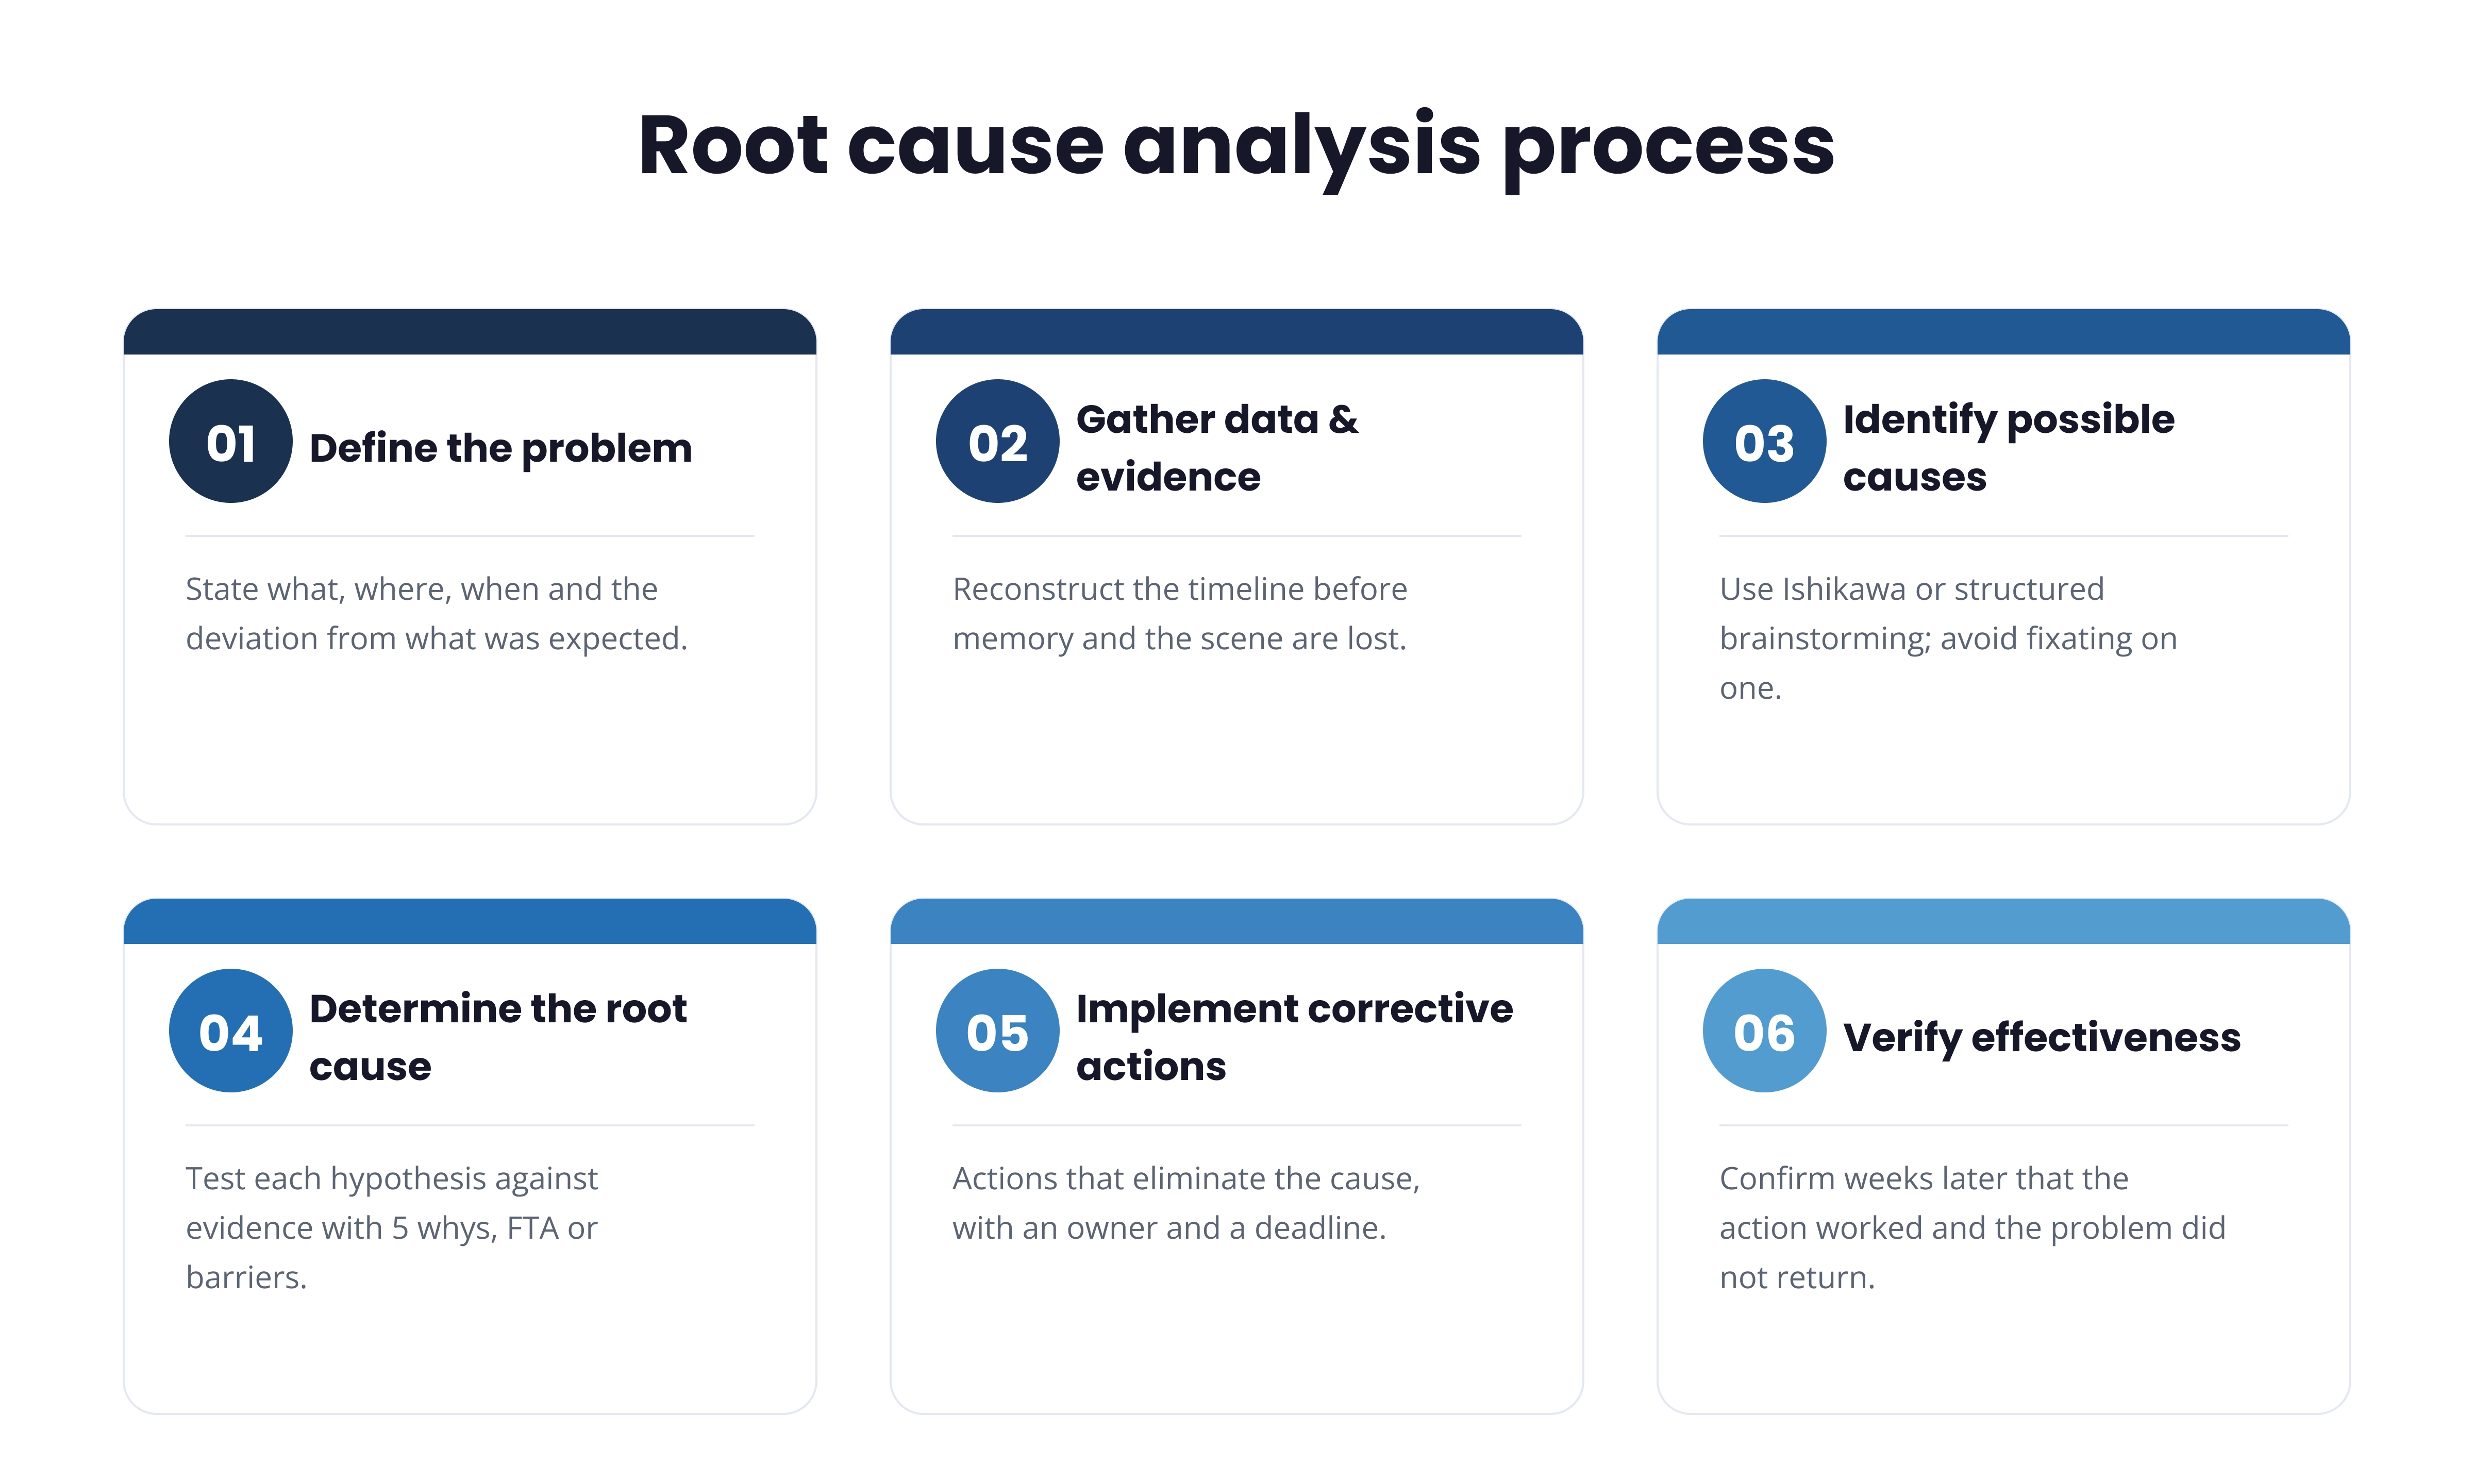
1. Define the problem precisely: what, where, when and how it deviates from what was expected.
2. Gather data and evidence: reconstruct the timeline before memory and the scene are lost.
3. Identify possible causes: use Ishikawa or structured brainstorming to avoid fixating on one hypothesis.
4. Determine the root cause: test each hypothesis against the evidence, with 5 whys, FTA or barrier analysis.
5. Implement corrective actions: define actions that eliminate the cause, with owner and deadline, not just the fix.
6. Verify effectiveness: confirm, weeks or months later, that the action worked and the problem did not return.
The final step is the one almost everyone forgets and the one that matters most. A corrective action without an effectiveness check is a hypothesis, not a solution.
Root cause analysis does not stand alone. It is the heart of the CAPA cycle (corrective and preventive actions), the process that turns the investigation result into real change. A corrective action acts on a problem that has already occurred, eliminating the cause to prevent recurrence. A preventive action acts on an identified risk before it materialises. Both depend on a well-identified root cause: without it, CAPA closes actions that solve nothing.
It is worth distinguishing a correction from a corrective action. A correction remedies the symptom, such as cleaning up a spill. The corrective action eliminates the reason the spill happened. A mature CAPA cycle always requires the final step of effectiveness verification, the same principle that, in FMEA, leads to recalculating the RPN after the action. That closing of the loop is what distinguishes a management system that learns from an archive of reports.
On a die-casting line, parts start coming out with porosity above the limit. The immediate cause is metal temperature out of range; the root cause, found through Ishikawa and 5 whys, is the absence of a periodic thermocouple calibration plan. The corrective action creates the calibration plan and an automatic alert for deviations, and the result feeds the quality indicators OEM auditors require.
The 2003 Northeast blackout in the United States and Canada is a real, landmark case of root cause analysis in complex systems. The investigation combined vegetation contact with power lines and a software failure in the monitoring system (SCADA) that stopped operators seeing the problem in time. The conclusion led to mandatory reliability standards, showing how a sound systemic RCA can change an entire sector.
The 2007 accident at T2 Laboratories, investigated by the US Chemical Safety Board, resulted from a runaway reaction whose cooling and pressure-relief systems were insufficient for the failure scenario. Fault tree analysis and barrier logic exposed latent design conditions, not a shift operator's error, a clear example of why an investigation cannot stop at the visible human action.
In a recovery boiler, the critical risk of smelt-water contact demands barrier-based RCA whenever a safeguard fails. A web break on the paper machine, in turn, combines 5 whys with change analysis: what changed in the process, the material or the machine setup immediately before the break. The root cause is often an undocumented setup change, not the operator.
An out-of-specification (OOS) result in a dissolution test triggers a phased investigation, as good manufacturing practice requires. The temptation is to attribute the deviation to laboratory error; a rigorous RCA follows the 5 whys to a process cause, for example a variation in tablet compression force, and feeds a traceable CAPA required by the FDA and ICH Q10.
The 2008 sugar dust explosion at Imperial Sugar, also investigated by the Chemical Safety Board, showed how combustible dust accumulation and failures in housekeeping and containment were the latent conditions behind the event. In a HACCP context, the same root cause discipline applies to a deviation at a critical control point: find the systemic origin, not the shift where it was detected.
Stopping at the immediate cause is the first. As soon as a plausible explanation appears, the investigation closes, and the problem returns. Blaming the person is the second and the most toxic: besides rarely being the real root cause, it dries up future reporting. Confirmation bias is the third, when the team pursues the hypothesis it already had in mind and ignores the evidence against it.
There is also the error of choosing the solution before understanding the problem, and of not verifying the effectiveness of the action, leaving it unknown whether the cause was actually eliminated. The antidote is always the same: methodical discipline, evidence before conclusions, and a cycle that only closes when verification confirms the event will not return.
The quality of root cause analysis shows up in an organisation's numbers. When RCA truly reaches the origin, the incident recurrence rate falls and outcome indicators improve. One of the most widely used to measure the severity of events is the total recordable incident rate, calculated as follows:
TRIR = (number of recordable cases × 200,000) ÷ total hours worked
The factor of 200,000 represents 100 full-time workers over one year. RCA acts on the cause of the events that make up this indicator; to understand the full calculation and how to interpret it, refer to the full page: [TRIR — Total Recordable Incident Rate].
For decades, root cause analysis lived in paper forms and spreadsheets. The investigation report sat in a drawer, the corrective action in a spreadsheet with no owner or deadline, and the link between a near miss today and a serious incident tomorrow was lost. The knowledge existed, but it did not circulate.
EHSQ software changes that reality by placing the investigation where the event happens. The operator reports from a phone, even offline, the investigation is conducted with method, the corrective action is created with an owner, a deadline and a verification trail, and everything is connected in a single flow. Glartek is the EHSQ software that connects EHS teams with field operators, making sure the identified root cause becomes a verifiable action rather than one more filed report.
The biggest leap is predictive. When every near miss and every nonconformity feed the same base, patterns become visible before the serious incident happens. It is the difference between reacting to events and anticipating precursors, and that is where root cause analysis stops being a retrospective exercise and becomes an engine of prevention.
.webp)
The immediate cause is the act or condition directly linked to the event, what you see first. The root cause is the fundamental system failure that allowed the immediate cause to exist. Fixing only the immediate cause resolves the symptom; acting on the root cause prevents recurrence.
Five is a reference, not a rule. The right number of whys is the one that reaches a correctable system failure: sometimes three are enough, sometimes six or seven are needed. Stopping too early leaves the root cause undiscovered.
Use the Ishikawa diagram when the problem may have several causes across different dimensions and benefits from structured team brainstorming. Use the 5 whys when the cause is likely single and you want to dig quickly into one line of reasoning. They often combine: Ishikawa raises the hypotheses, the 5 whys deepen the strongest one.
Indirectly, yes, in many regimes. ISO 45001:2018 requires evaluating the need to eliminate the root cause of incidents and nonconformities. In the UK, RIDDOR 2013 and the OSH Framework Directive across Europe require recording and reporting occupational accidents, and cause investigation is how organisations meet those duties.
Rarely. Human error is usually an immediate cause; the root cause lies in the latent conditions that made the error likely, such as confusing procedures, insufficient training or missing barriers. Stopping at human error is stopping too soon and missing the chance for real prevention.
CAPA stands for corrective and preventive actions. RCA identifies the cause; CAPA turns that cause into action, with an owner, a deadline and an effectiveness check. A corrective action eliminates the cause of a problem that occurred; a preventive action acts on a risk before it materialises.
After any incident, near miss or nonconformity with the potential to recur or to be serious. Investigating near misses is particularly valuable: they are free warnings that reveal causes before they lead to a serious injury.
It is a dormant weakness in the system, created upstream by decisions about design, procedures or management, which lies hidden until it aligns with other failures and enables the event. In the Swiss cheese model, they are the holes in the layers of defence that rarely appear alone in the shift report.
It depends on complexity. A 5 whys analysis can close in an hour; a fault tree for a critical system can take weeks and involve several specialists. What matters is not speed, but reaching the correct cause and then verifying the effectiveness of the action.
EHSQ software brings the investigation to the point where the event happens, ensures the corrective action is created with an owner and a deadline, and links every near miss and nonconformity to a common base that reveals patterns. Glartek automates that flow, from the field report to the effectiveness check, turning the root cause into measurable prevention.
Request your demo
Start your EHSQ software journey with Glartek and become a leader in your industry.
Schedule Demo.webp)
Discover the power of the only AI-Native EHSQ software built for the frontline

.webp)