The accident pyramid, or safety triangle, is a model that relates the frequency of serious, minor and no-injury events in the same workplace. Its premise is that for every serious accident there is a far larger number of minor injuries and, at the base, an even greater number of near misses. It was proposed by H. W. Heinrich in 1931 as the 300-29-1 ratio and expanded by Frank Bird in 1966 as the 1-10-30-600 ratio, which added property damage and near misses to the count.
The accident pyramid is the visual form of a simple idea: serious accidents are the visible tip of a much broader base of lower-severity events. Near misses and no-injury situations sit at the base, minor injuries and property damage above them, and at the top, rare but severe, the serious injuries and fatalities. The model argues that these layers are related in frequency and that working on the base helps bring down the top.
The original version was published by Herbert William Heinrich in 1931, in Industrial Accident Prevention: A Scientific Approach. Heinrich worked as an assistant superintendent at an insurance company and reviewed more than 75,000 accident reports to arrive at his well-known ratio of one serious injury to 29 minor injuries to 300 no-injury events. Decades later, Frank E. Bird Jr. revisited the idea with a far larger dataset and redrew the pyramid, adding two levels Heinrich had not isolated: property damage and near misses.
Across Europe, the model underpins the preventive logic that EU Directive 89/391/EEC and ISO 45001:2018 formalise: identify the hazard and act before the consequence materialises. The pyramid gives that priority a visual language, showing that most risk signals appear long before the serious accident, in events that rarely reach the EHS team where no reporting culture exists. In the UAE, frameworks such as OSHAD-SF push the same emphasis on leading indicators and incident reporting ahead of lagging outcomes.
Reading the pyramid as a timeline makes clear what it claims and what has already been corrected. Heinrich produced the first drawing; Bird widened the base and shifted the focus; contemporary practice has added a critical layer that neither of them had the data to see.
Heinrich proposed the 300-29-1 ratio from the reports he could access at the insurance company and in company records, drawing from them a blunt practical conclusion, since he argued that if a company reduced the number of minor accidents it would see a proportional fall in serious accidents. The same book carried two other influential ideas. The first, known as the 88-10-2 ratio, held that 88% of accidents supposedly stemmed from people's unsafe acts, 10% from unsafe conditions and only 2% from unpreventable causes. The second, the domino theory, pictured the accident as a sequence of five falling tiles, running from ancestry and social environment through to the injury, with the unsafe act at the centre of the fall.
One nuance that popular use of the model erased is worth recording, because although Heinrich's most quoted line pins most accidents on human failure, his book itself devoted more than a hundred pages to machine guarding and argued that no safety programme was complete until it corrected or eliminated the physical hazards. The behavioural reading that dominated the twentieth century was, in that sense, largely a simplification of what he actually wrote.
Frank E. Bird Jr. revisited the pyramid in 1966 with a dataset of a different scale: around 1.75 million accident reports from almost 300 companies across several sectors. From that analysis he proposed the 1-10-30-600 ratio, read top to bottom as one serious or disabling injury, 10 minor first-aid injuries, 30 property-damage accidents and 600 near misses, meaning events with no visible injury or damage. Bird's figures were later corroborated by a 1974 study by A. D. Swain on the human element in systems safety.
Bird and George Germain went on to develop the model in Practical Loss Control Leadership, which placed it inside a wider loss-control logic. For Bird, the central message lived at the base: most accidents could be predicted and prevented if an organisation paid attention to near misses and property damage, rather than waiting for the injury to react.
The difference between the two models is not only in the numbers. Heinrich stopped at the injury: his lowest level was no-injury accidents. Bird went two steps lower and made property damage and near misses visible, categories that cost money and expose risk even when no one is hurt. That widening of the base is Bird's most lasting contribution, because it moves management attention to where there are more signals and where intervention is cheapest.
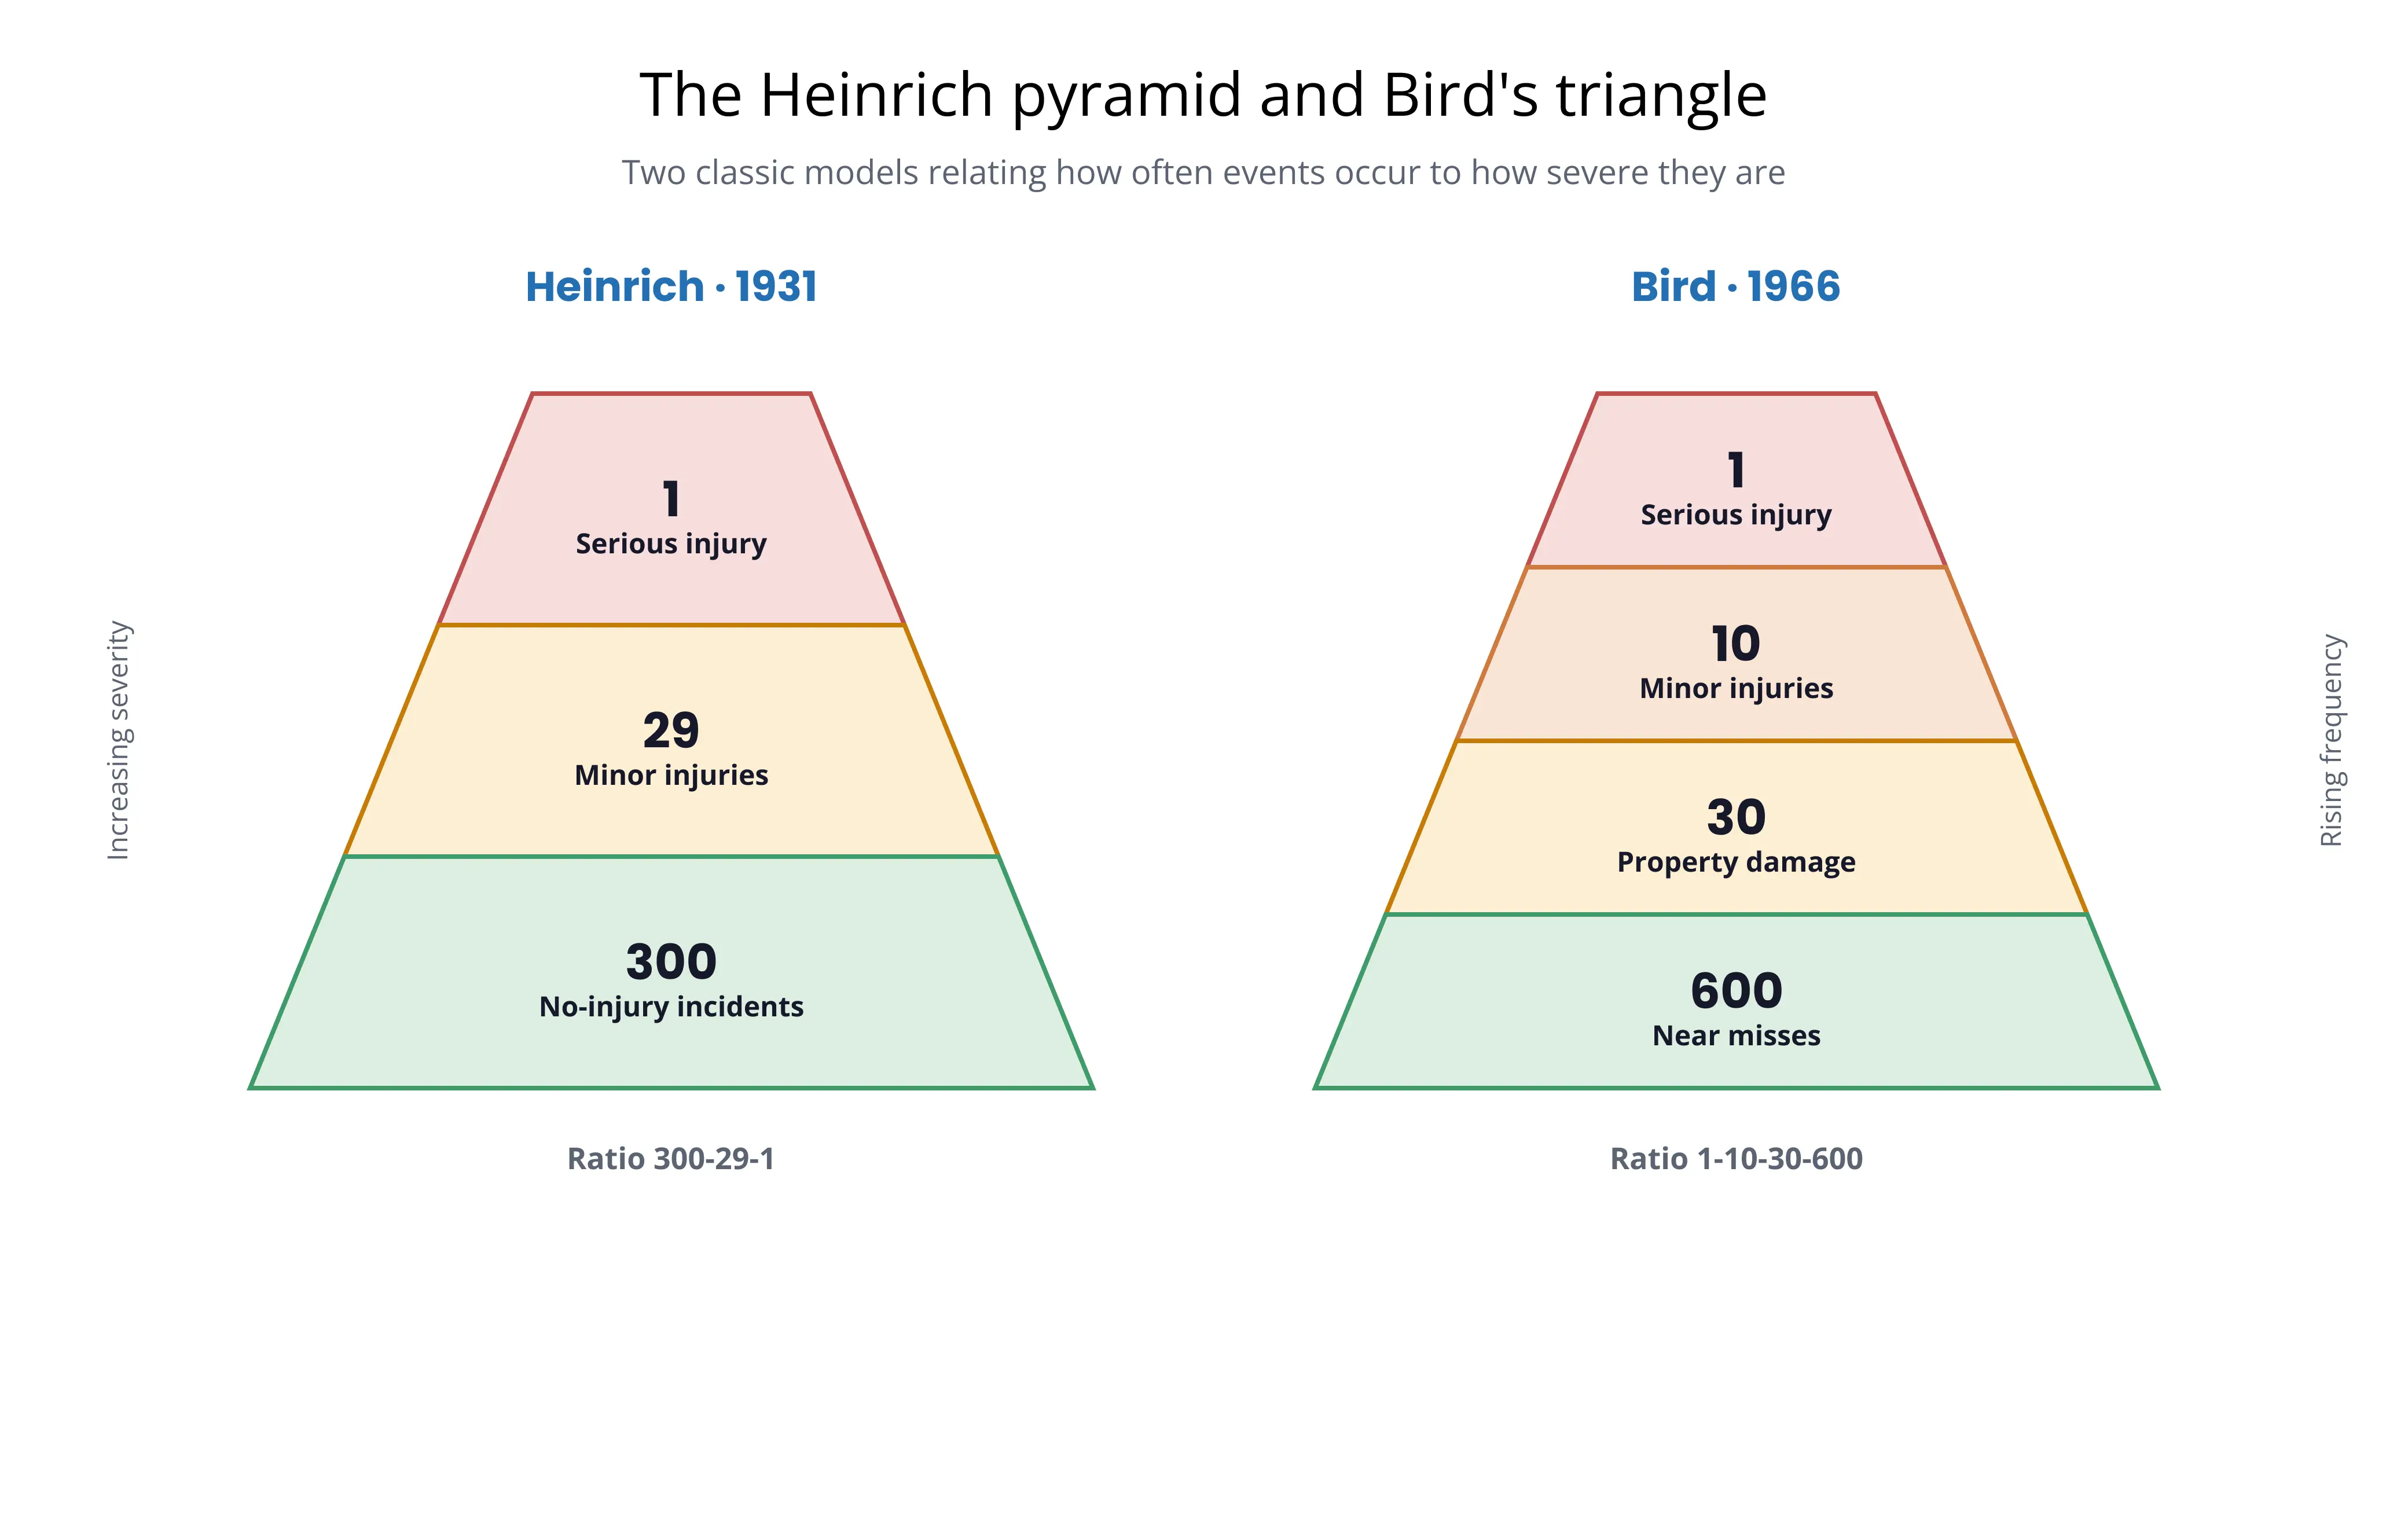
Almost a century after Heinrich, the pyramid is still taught because it captures, in one image, the difference between safety that reacts and safety that anticipates. Its practical value changes with who is looking at it.
For the person accountable for safety, the pyramid is a visual argument for reporting the base. As long as a company only measures recordable injuries, it is looking at the top and ignoring the thousands of signals that precede it. By structuring the capture of near misses and unsafe conditions, the manager gains data on what has not yet happened, which is precisely where prevention is possible. The pyramid also provides language to defend investment to the board, because it shows that the absence of serious accidents does not mean the absence of risk.
At board level, the reading is one of exposure and cost. Every level of the pyramid carries a price, and the lower levels, though individually cheap, accumulate production losses, rework and equipment damage that rarely reach the safety ledger. More importantly, the base of the pyramid is the leading indicator that the top may grow. An organisation watching near misses rise has a warning of risk before the fatality and the legal liability arrive.
For HR and operations, the pyramid helps change the conversation about error. If the model shows that the serious accident is rare but has hundreds of precursors, then the goal stops being to punish those who report and becomes to encourage reporting. A line that stops for two minutes to log a near miss is feeding the base of the pyramid with information worth more than the time lost. That only works in a culture where reporting is seen as a contribution, not an accusation.
The pyramid is only useful once you understand what each layer represents and why the base matters more than the top for anyone who wants to prevent. From bottom to top, the logic is one of rising severity and falling frequency.
The practical reading that follows is the distinction between lagging and leading indicators. Recordable injuries are lagging indicators: they count what has already gone wrong. Near misses, reported unsafe conditions and behaviour observations are leading indicators: they measure the prevention effort before the harm. The base of the pyramid is, in essence, the territory of leading indicators, which is why a mature organisation devotes so much energy to filling it with data.
There is, however, a condition the original model hid: the pyramid only fills if people report. In low-trust environments the base is artificially empty, not because near misses do not happen, but because no one logs them. A pyramid with a narrow base may signal excellence or silence, and telling the two apart is one of the central tasks of EHS management.
The most important point on this page is also the most uncomfortable: the pyramid's central premise, that reducing minor injuries reduces serious injuries in the same proportion, does not hold up against modern evidence. It was this assumption that led decades of programmes to concentrate on lowering the frequency of small injuries, in the expectation that fatalities would fall with them. In many sectors, small injuries fell and fatalities stalled.
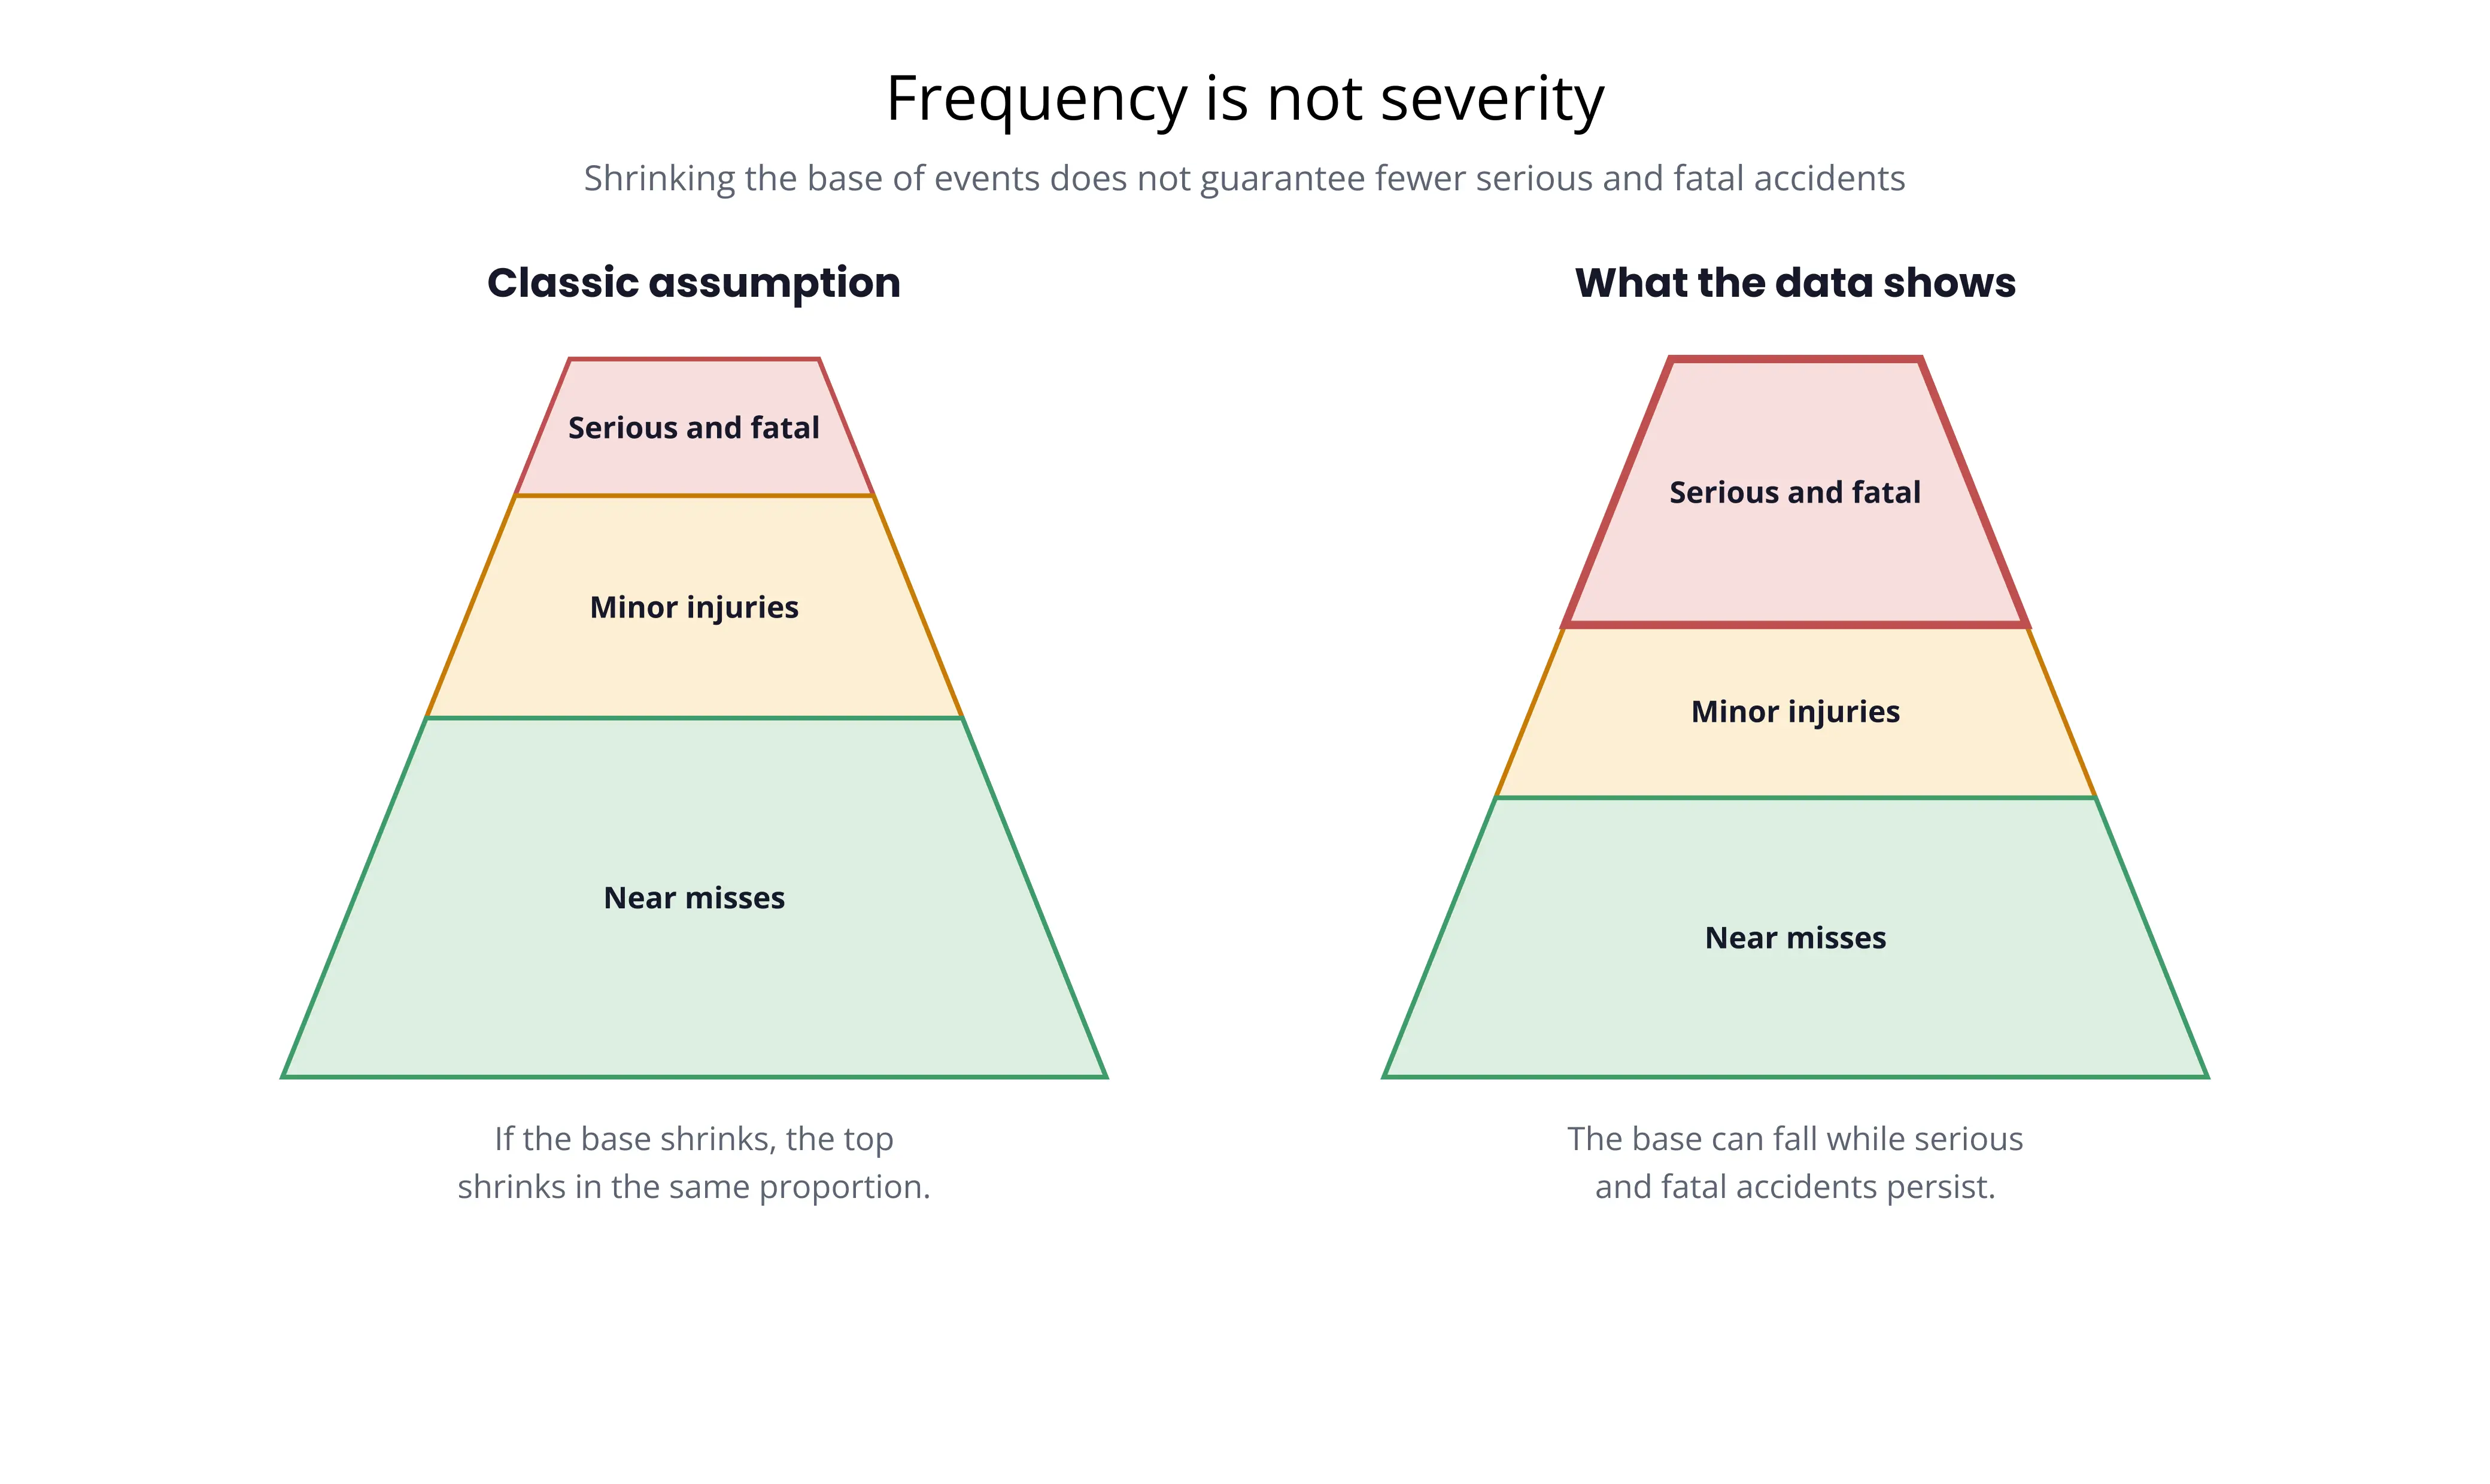
The most systematic criticism came from Fred Manuele, who in Heinrich Revisited: Truisms or Myths, published by the National Safety Council in 2002, reviewed Heinrich's premises one by one and reached severe conclusions. To begin with, Heinrich's original research files no longer exist, which makes it impossible to verify the quality of the data on which the pyramid rested. To that we can add the fact that the 300-29-1 ratio was changed from edition to edition without any explanation. Above all, the idea that the causes of no-injury events would be identical to those of serious injuries does not stand, because modern investigations of serious and fatal accidents show that their causal factors often do not match those of frequent, low-severity events.
From this grew the concept of SIF, for serious injuries and fatalities. The argument is that these events have their own causal dynamic and must be managed separately, with attention to their specific precursors, rather than as the automatic peak of a pile of small injuries. Studies by the Campbell Institute and authors such as Martin and Black indicate that only around 20% to 24% of recordable incidents share precursors with serious and fatal events. In other words, most precursors of a fatality do not appear in the statistics of common injuries, and a company chasing frequency alone can improve its numbers and remain exposed to the worst outcome.
None of this cancels the pyramid, but rather requalifies it, because the base still holds valuable signals even if not every one of them points to the same kind of outcome. The correct reading is therefore twofold, since it means filling the base with data to prevent the bulk of accidents while, at the same time, identifying and treating separately the high-potential precursors, those whose next repetition could kill. Deming framed the root of the problem differently, arguing that most accidents stem from failures in management systems rather than individual actions, which shifts the focus from blaming the worker to the design of the work itself.
In a metalworking or packaging plant, the base of the pyramid fills with very concrete near misses, such as a spanner left on a press, a machine guard open during cleaning or a forklift braking centimetres from an operator. In isolation they look trivial, yet read together they show where the next crush or amputation injury is most likely and let the plant act on the guard or the procedure before the finger reaches the danger zone.
In grid and generation operations, many high-potential precursors live at the base and rarely hurt anyone at once: a permit to work (PTW) issued without confirmed lockout/tagout (LOTO), a clearance from a live line smaller than required, an absence-of-voltage test skipped under time pressure. These are exactly the SIF precursors that a naive reading of the pyramid tends to dilute among low-risk near misses, which is why they must be classified by potential, not only by frequency.
In a chemical plant, telling the broad base from the serious precursors is vital. Small spills, valves that close with difficulty and temperature deviations within margin make up the base. But a process alarm repeatedly ignored, or a safety interlock put in bypass, belong to the high-potential category, because their next repetition may not be a minor injury but a release or an explosion. The pyramid helps frame the volume, whereas the focus on potential keeps what truly matters from being lost within it.
In paper and pulp mills, the base gathers near misses around rollers, belts and steam: an access panel removed without lockout, a blocked walkway, a slip near a hot line. Consistently logging these events reveals layout and maintenance patterns that precede entanglement and burn injuries, and lets the mill prioritise the fixes where the signal repeats.
In pharmaceutical manufacturing, the pyramid intersects with quality. A deviation from good practice, equipment out of calibration or a label mix-up narrowly avoided are, at once, safety near misses and quality non-conformances. The same operator who prevents a dosing error is feeding two pyramids simultaneously, and handling them in the same reporting and corrective-action flow stops the signal from being lost between departments.
In a food and beverage facility, safety and quality share the same base. A wet floor near a filler, a foreign body nearly introduced into the line, a cold store with a faulty latch: each is a signal that, left untreated, rises in the safety pyramid or the quality one, with impact on HACCP and on BRC or IFS audits. Capturing these events in the operation, at the moment they happen, is what keeps them from reaching the recall or the accident.
Using the pyramid well in 2026 means keeping what it got right and correcting what the evidence has disproved, which in practice comes down to three moves that reinforce one another.
The first is to fill the base with easy, blame-free reporting, since a pyramid is only worth the data it receives and that data only arrives when logging a near miss is quick and safe for the person doing it. What matters, then, is not a wide base in the reports but a base that genuinely matches the reality of the shop floor.
To that effort of volume we have to add the need to separate frequency from potential, because not every near miss carries the same weight. Current practice classifies each event by its potential severity and isolates the high-potential precursors, those whose next repetition could cause a serious or fatal event, so that these receive deep investigation and priority action however rare they are, while the bulk of the base is handled through trends and patterns.
Finally, and this is perhaps the hardest lesson to absorb, it matters to act on the system rather than on the person. The thread running through Heinrich, Bird, Manuele and Deming is that sustainable prevention comes from correcting latent conditions, missing barriers and process failures, and not from holding to account the operator who merely stood at the end of the chain. The pyramid shows where to look, whereas root cause analysis says what to fix.
An organisation that combines these three moves turns the pyramid from a poster on the wall into a living system, in which the base feeds the decision, the serious precursors are handled separately and every corrective action reduces real risk instead of dressing up an indicator.
The pyramid gains traction when it connects to the metrics that measure each of its layers. The base corresponds to the proactive reporting effort, measured by the near miss frequency rate, while the top is tracked by lagging indicators such as the recordable rate. The near miss frequency rate relates the number of reported near misses to hours worked, in a formula of the type (reported near misses × 200,000) ÷ hours worked, and works as a leading indicator of the health of the pyramid's base.
To understand how this indicator is calculated and interpreted, and how to set reporting targets without encouraging under-reporting, refer to the full page: [NMFR — Near Miss Frequency Rate].
For decades, the pyramid lived on paper and notice boards. Near misses were jotted in notebooks, lost between shifts and reached, if they reached at all, the person who could act too late. The base of the pyramid was in practice inaccessible, not because the events did not exist, but because the effort of logging them competed with real work and lost.
Digitalisation changes that economy. With EHSQ software, the operator logs a near miss on a phone, at the moment and place it happens, even without a connection, with the sync completing later. What once required a form and a walk now costs seconds, and the base of the pyramid stops depending on the goodwill of people under time pressure. The same record automatically feeds the corrective-action flow (CAPA) and the indicator dashboards, with no manual transcription.
The next layer is correlation. When the base data is structured, events can be classified by potential, the recurring precursors identified and the patterns that precede serious and fatal events flagged, something the manual reading of a pile of paper never allowed. This is where management stops reacting to the top of the pyramid and starts anticipating, from the signals the base finally gives it to see.

Heinrich proposed a three-level pyramid in 1931, as the 300-29-1 ratio, running from no-injury events to serious injury. Bird, in 1966 and with a far larger dataset, added two levels Heinrich did not isolate, property damage and near misses, and arrived at the 1-10-30-600 ratio. The key difference is that Bird made the base of no-injury, no-damage events visible, moving attention to where there are more risk signals.
No. Heinrich's and Bird's ratios are historical averages of specific datasets, not universal constants. Later studies found very different proportions depending on the sector and type of activity. They should be read as an illustration of the relationship between levels, not as a number to apply literally to any one company's reality.
The structure remains useful for explaining why it is worth looking at the base of low-severity events. What modern evidence invalidated was the assumption that reducing minor injuries reduces serious injuries in the same proportion. The pyramid holds up as a communication and reporting-incentive tool, provided it is paired with specific management of serious and fatal events.
Because serious and fatal events often have different causes from minor injuries. Studies indicate that only around 20% to 24% of recordable incidents share precursors with serious and fatal events. A company can sharply reduce the frequency of minor injuries and leave the precursors of a fatality intact, because these do not appear in the statistics of common events.
SIF stands for serious injuries and fatalities. The concept holds that these events need to be managed separately, with a focus on their specific high-potential precursors, rather than treated as the automatic result of a pile of small events.
It is an event with the potential to cause injury or damage that, by chance or by timely intervention, did not. It sits at the base of the pyramid and is the most abundant risk signal. Capturing it is what allows action before the same failure produces a real consequence.
It is a sibling model, also proposed by Heinrich. The domino theory pictures the accident as a chain of causes falling in sequence towards the injury, with the unsafe act at the centre. While the pyramid describes the relative frequency of outcomes, the domino describes the causal sequence that leads to each of them.
By potential severity, not only by frequency. Current practice separates the high-potential precursors, those whose next repetition could cause a serious or fatal event, from the bulk of low-risk events. The former get deep investigation and priority action; the latter are managed through trends and patterns.
Yes. The same logic applies to non-conformances: small deviations and near-errors precede more serious quality failures. In sectors such as pharmaceutical and food and beverage, the same event can be at once a safety near miss and a quality non-conformance, and handling them in the same flow stops the signal from being lost.
EHSQ software makes reporting the base quick and accessible, even offline, and links each event to corrective action and to the indicator dashboards. With structured data, events can be classified by potential and the patterns that precede serious events identified. Glartek was designed so that this reporting starts on the frontline and reaches management without manual transcription, keeping the base of the pyramid fed with real data.
Request your demo
Start your EHSQ software journey with Glartek and become a leader in your industry.
Schedule Demo
Discover the power of the only AI-Native EHSQ software built for the frontline